
Conductors
Consistently high-accuracy wire extraction in internal validation, including corridors and sensors the model had not previously seen.
SmartData powerline intelligence software
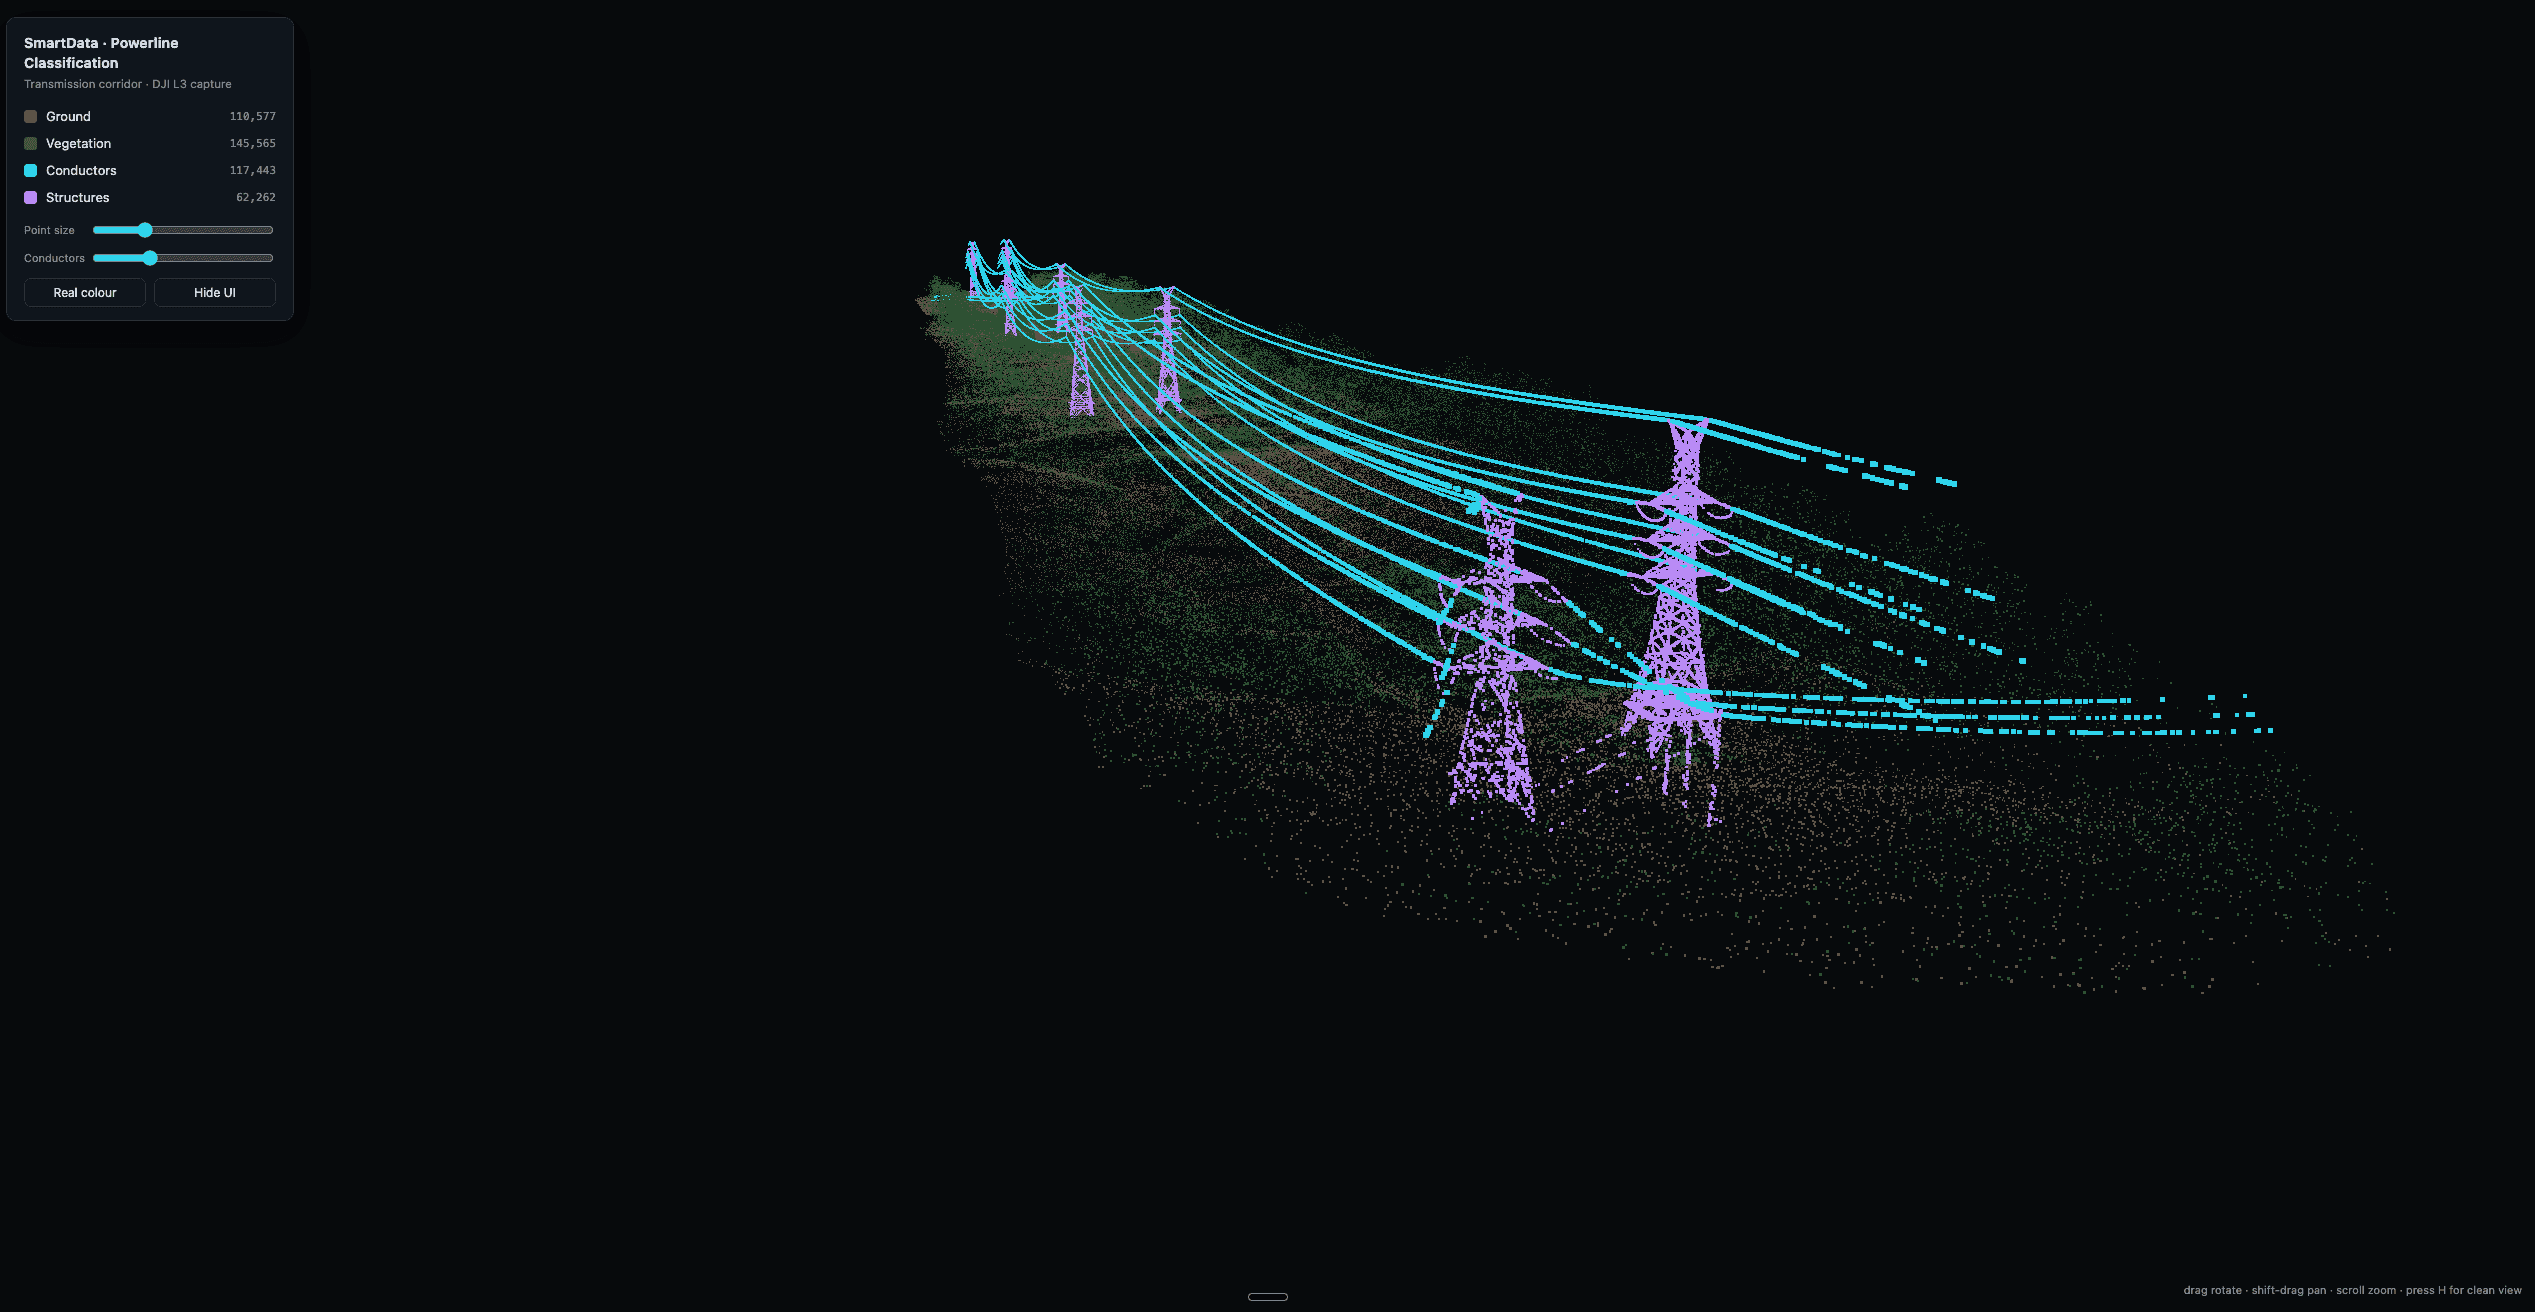
SmartData finds conductors, poles, towers, vegetation, and ground in LiDAR corridor captures, then turns the classified network into geometry, spans, clearance screening, and review-ready evidence.
Available for scoped pilots
Utility data, asset, and vegetation teams
96%+
pole and tower precision in internal validation
DJI L3
and corridor-mapping LiDAR supported
< 1 day
demonstrated review-to-retrained-model loop
Powerline intelligence, built in
The classifier is trained and validated against expert-reviewed ground truth from live Australian corridors: distribution and transmission, open easements and heavy canopy, across multiple LiDAR sensors.
SmartData keeps the processed DJI L3 corridor and the classified network connected so teams can move from source evidence into powerline analysis without another viewer handoff.
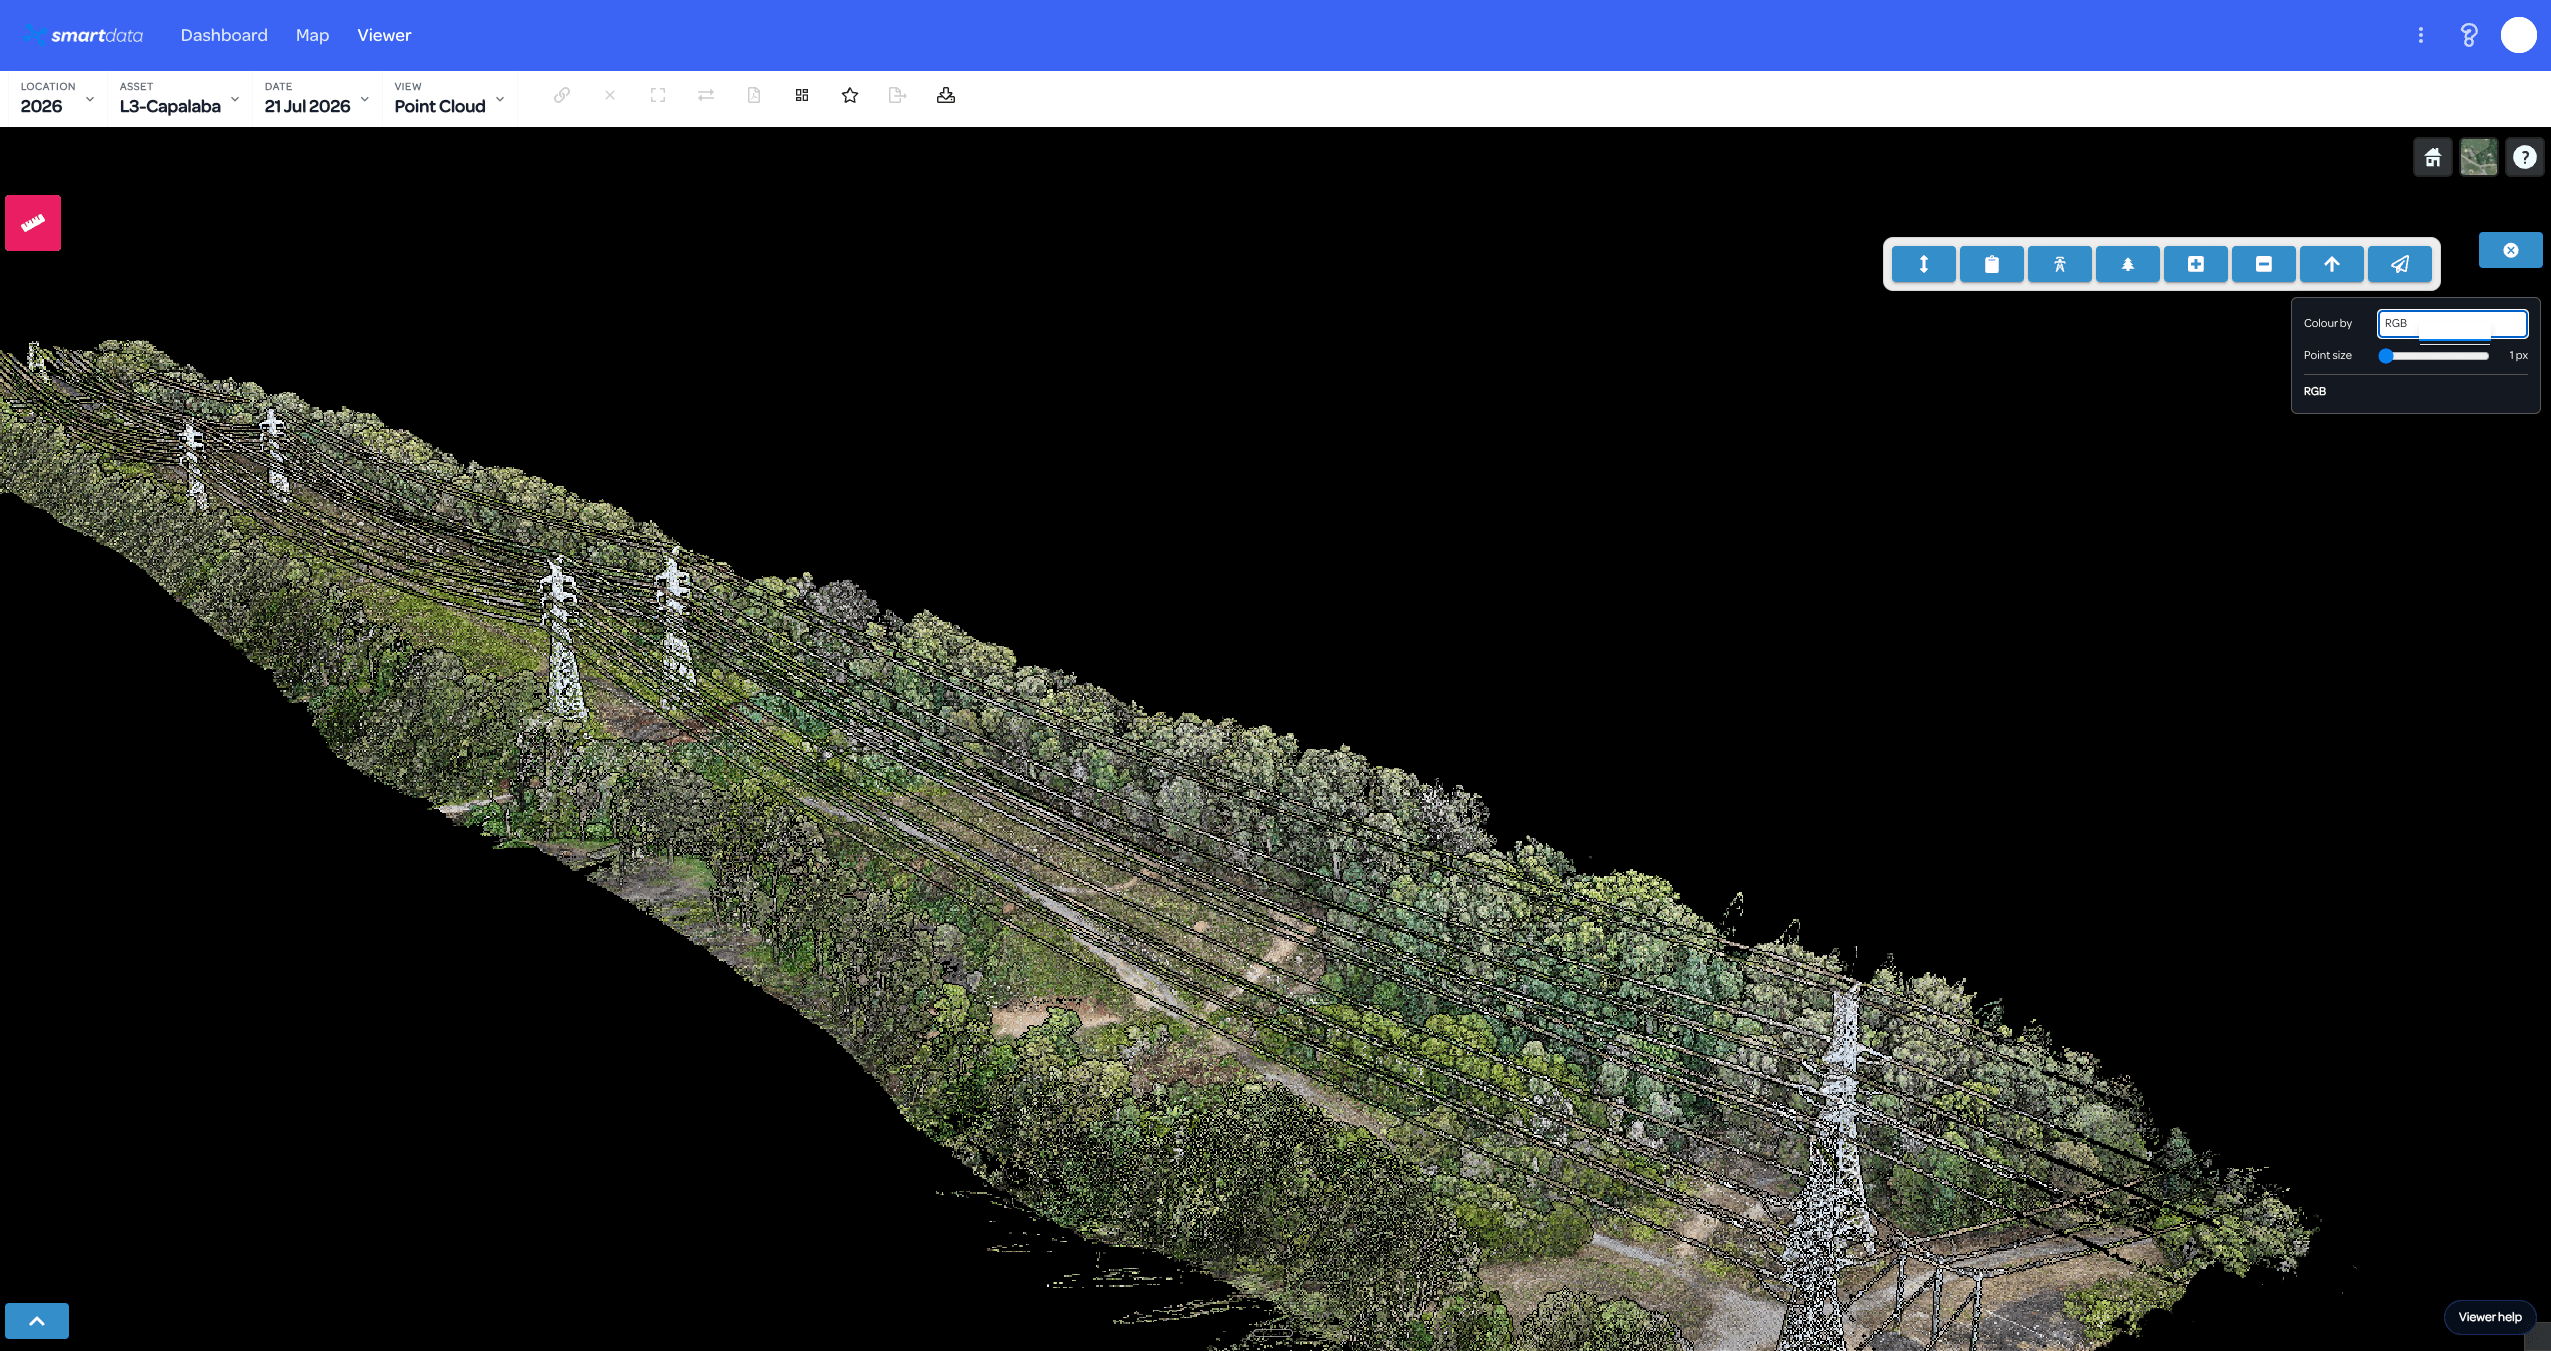
01 Processed corridor
Georeferenced RGB point cloud ready for hosted review and downstream processing.
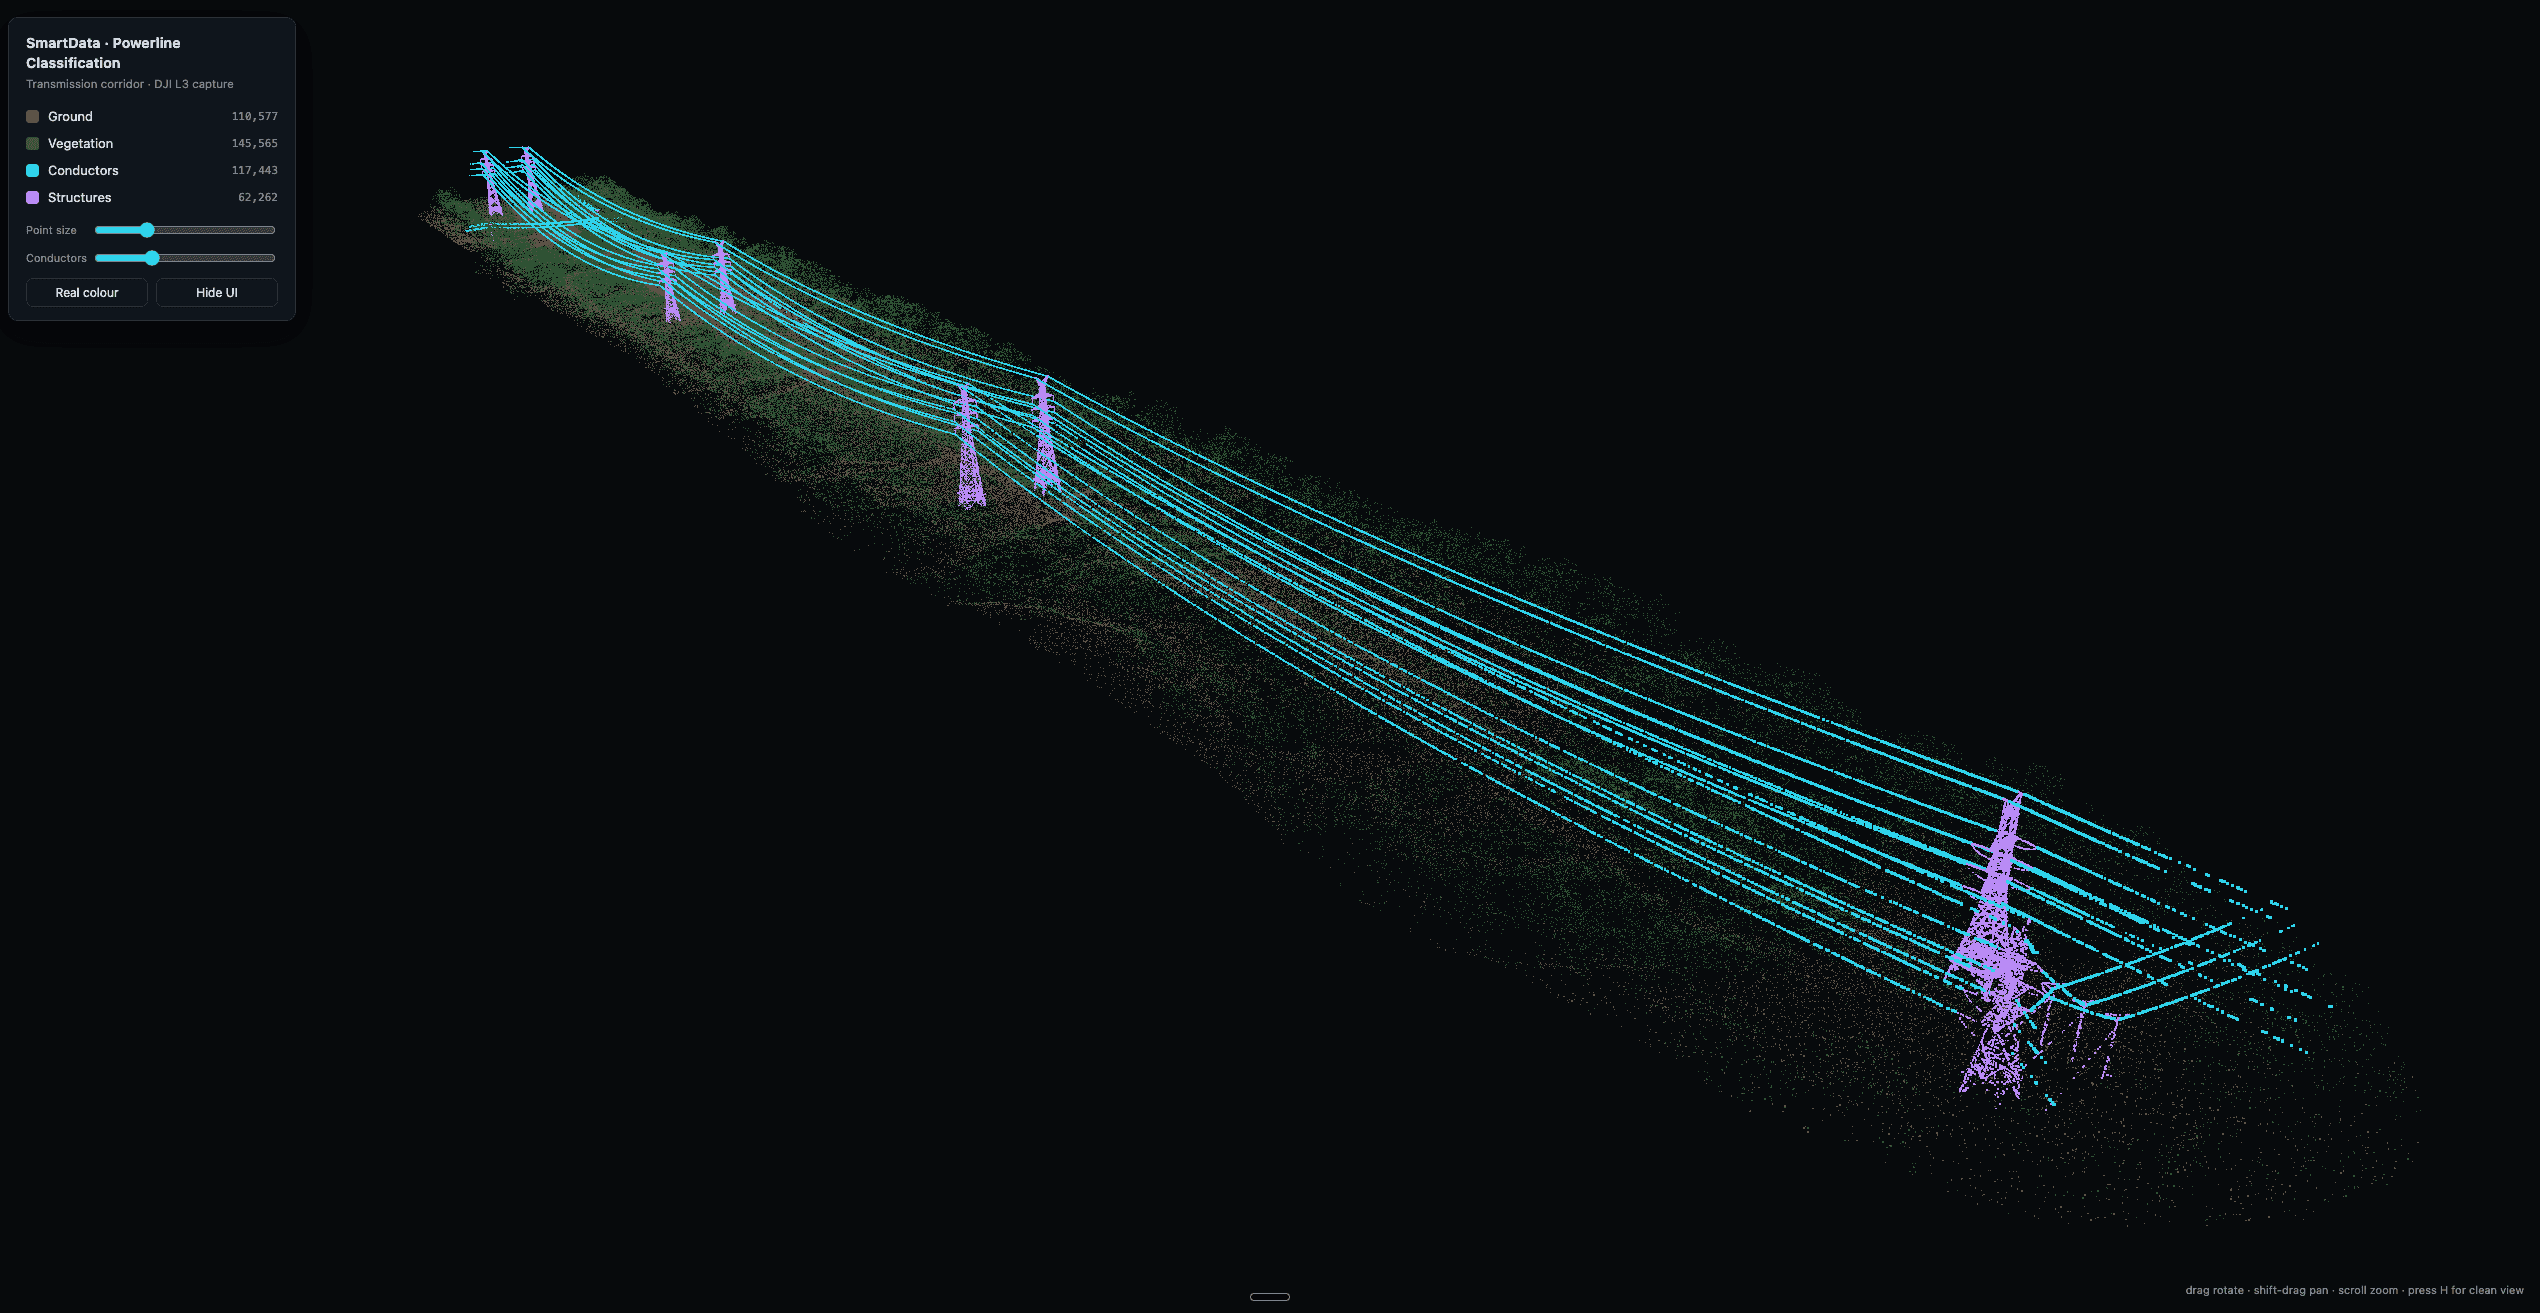
02 Classified network
Conductors, structures, vegetation, and ground separated while retaining their corridor context.
Consistently high-accuracy wire extraction in internal validation, including corridors and sensors the model had not previously seen.
96%+ precision in internal validation, from timber distribution poles to lattice transmission towers.
Validated across corridor-mapping payloads and DJI L3 drone LiDAR without changing the downstream processing workflow.
Training and validation use expert-reviewed ground truth from live Australian distribution and transmission corridors.
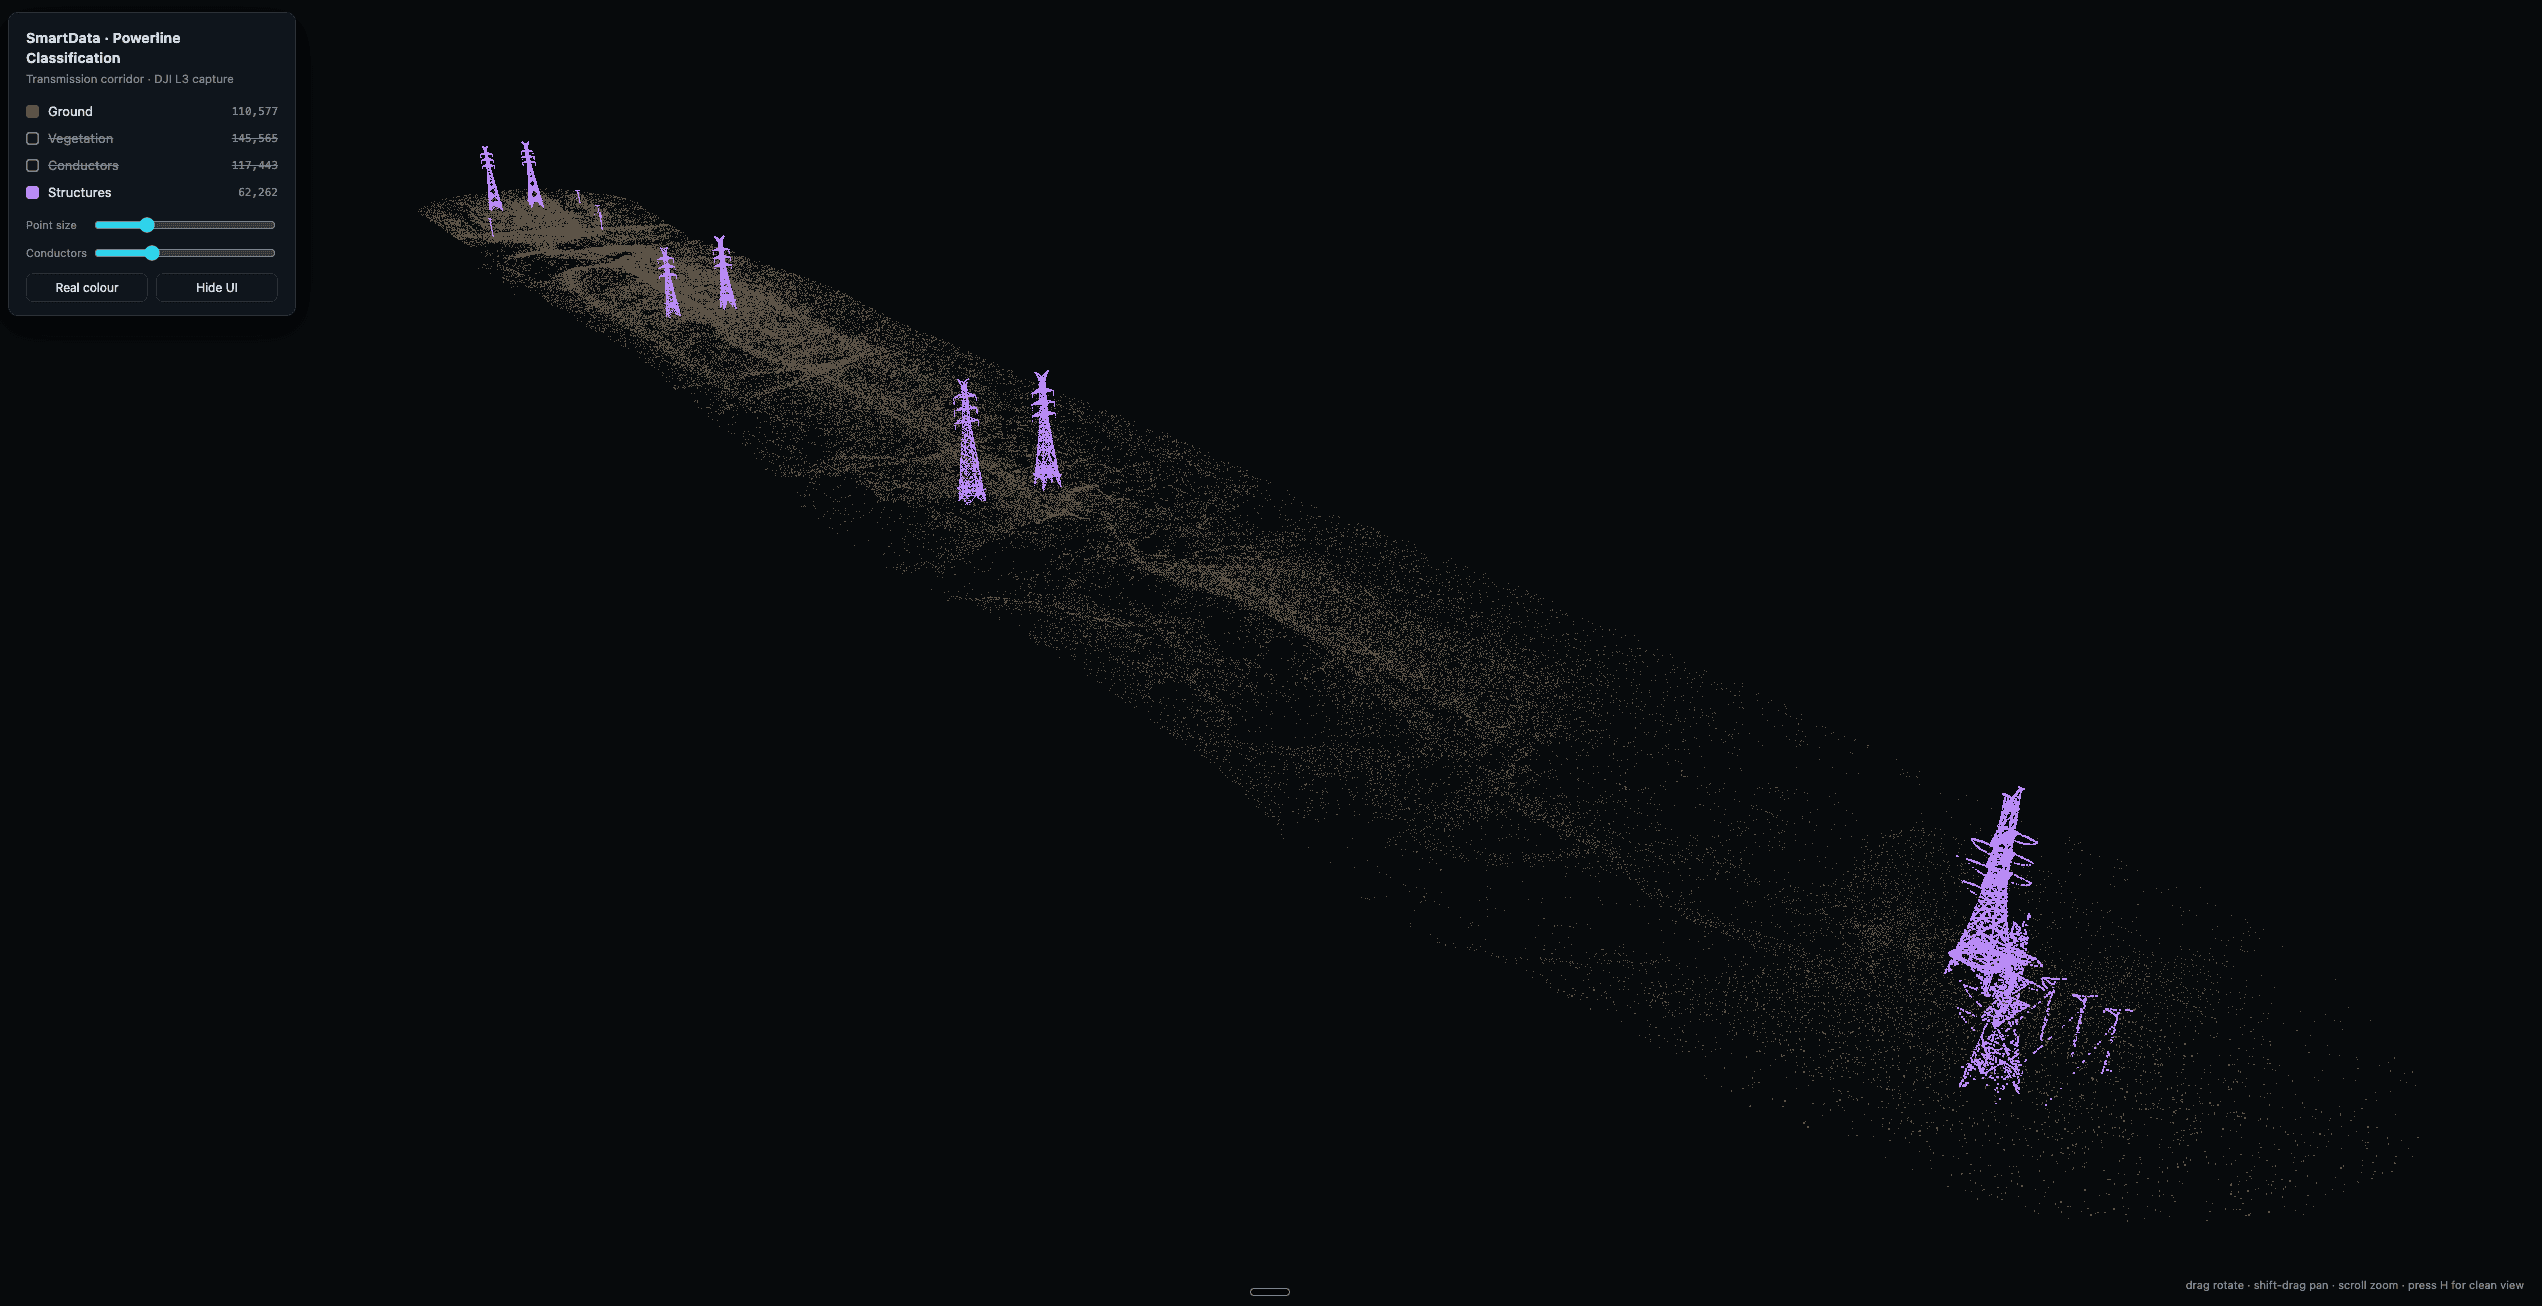
Toggle classes independently to inspect timber poles, lattice towers, and mixed structure types before downstream analysis.
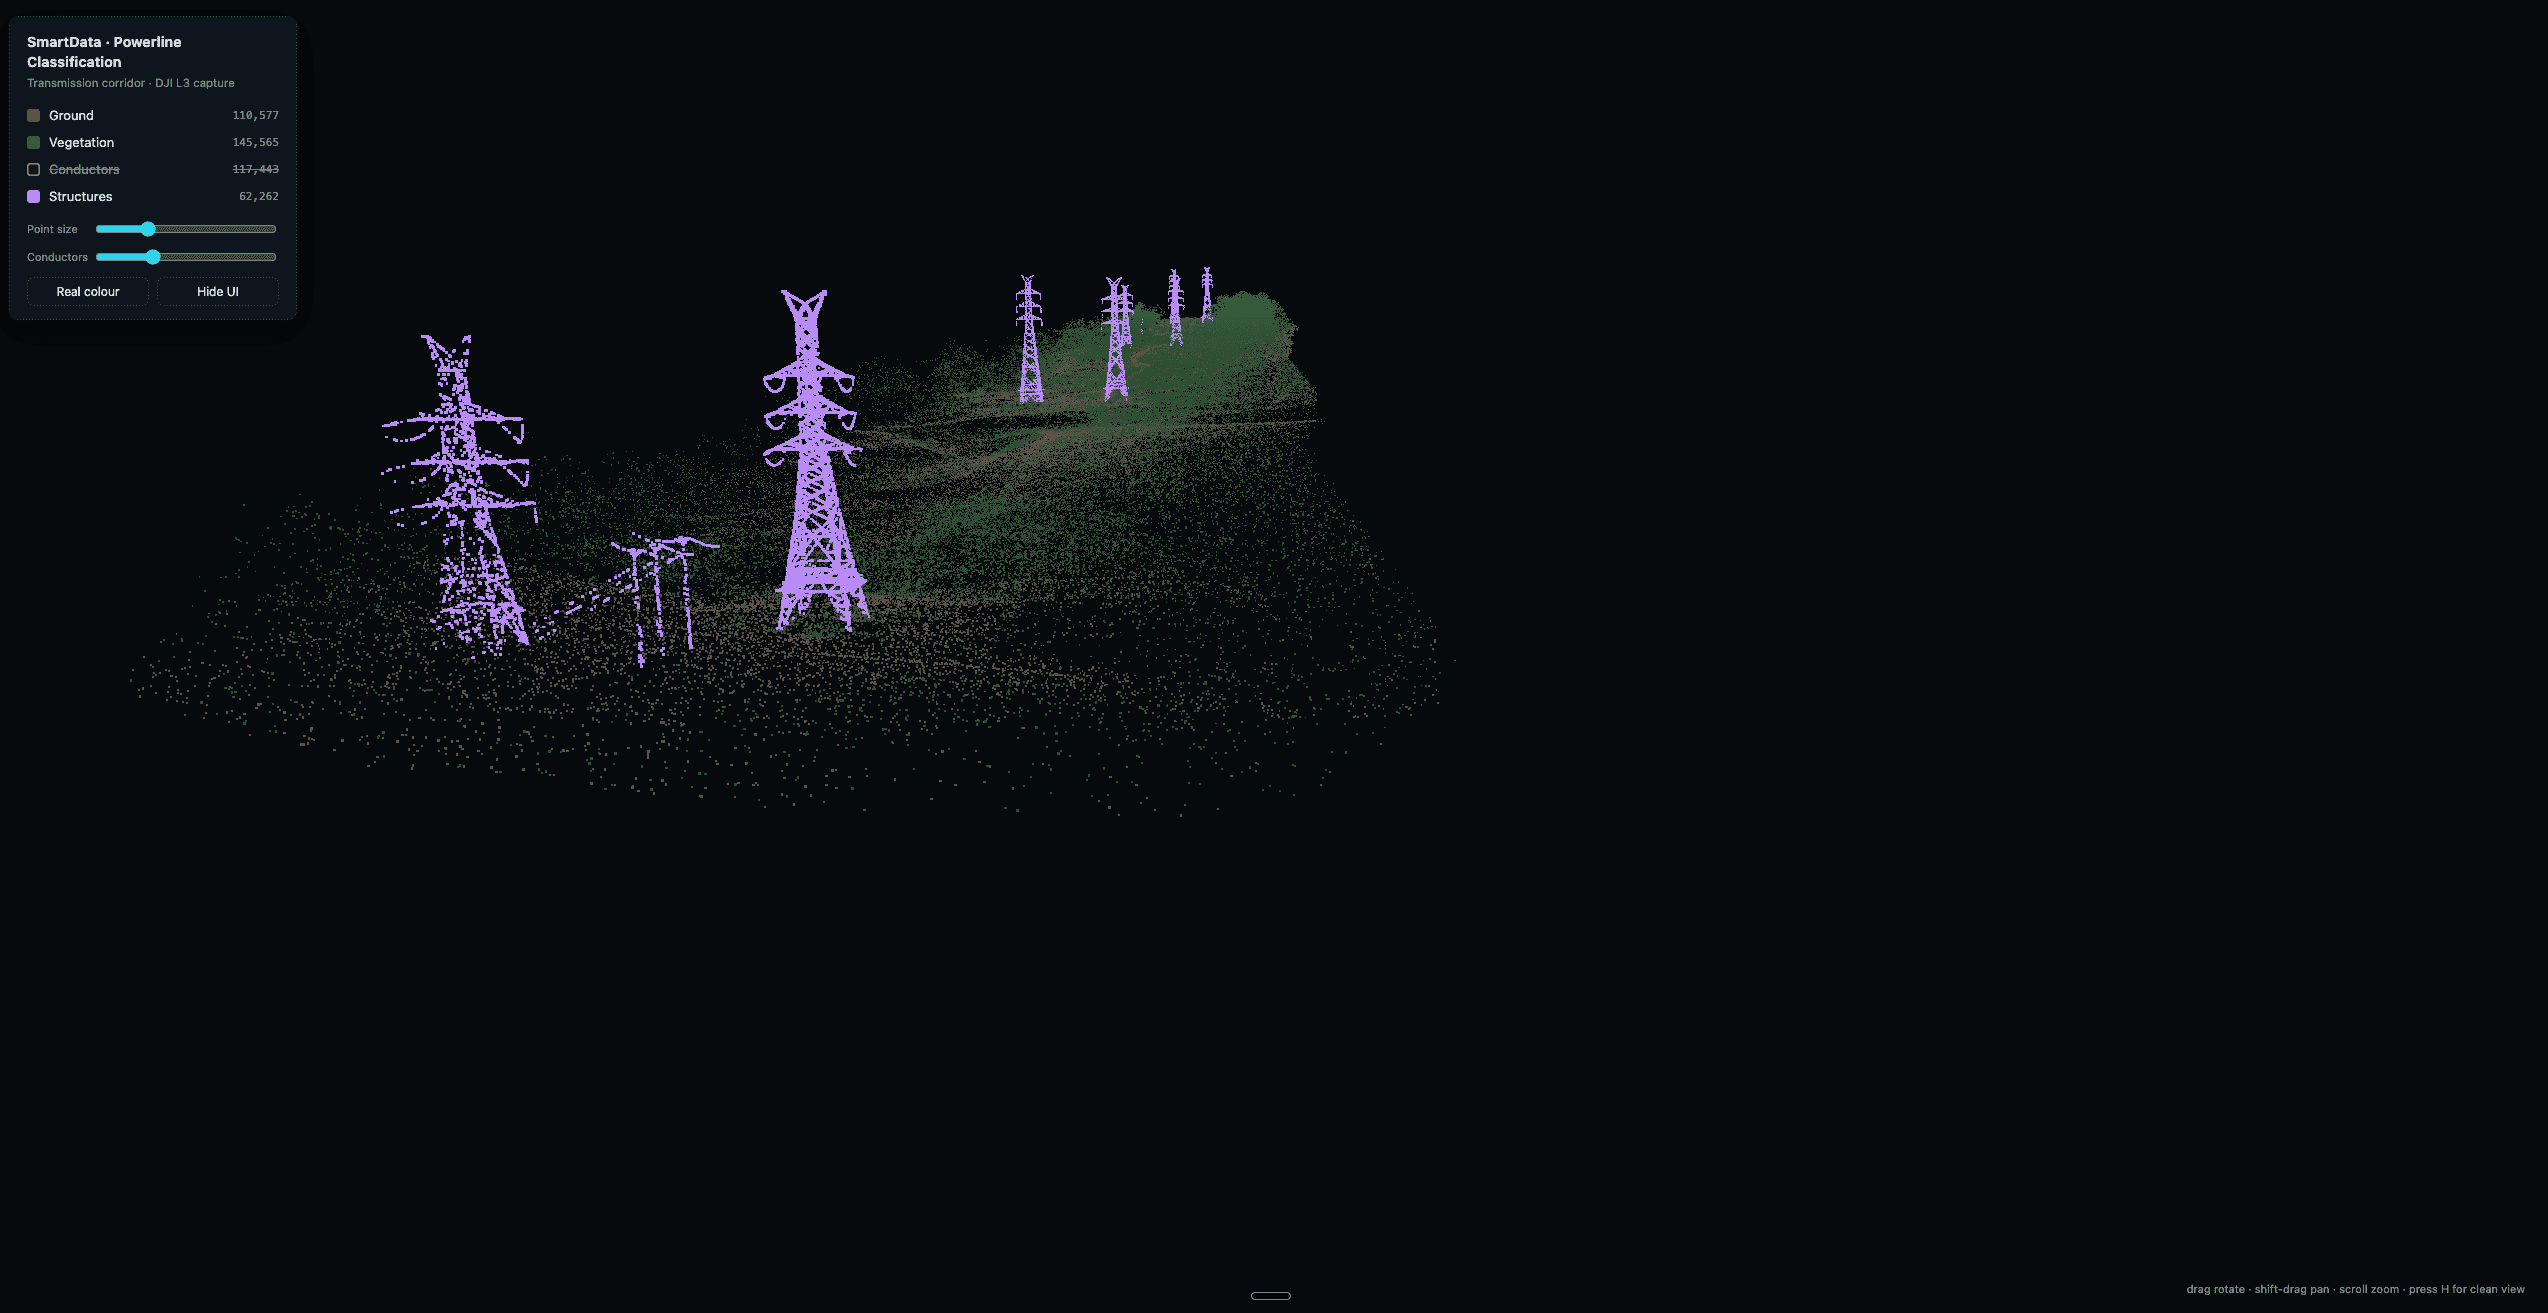
Review structure classification through changing terrain, dense vegetation, and overlapping network geometry.
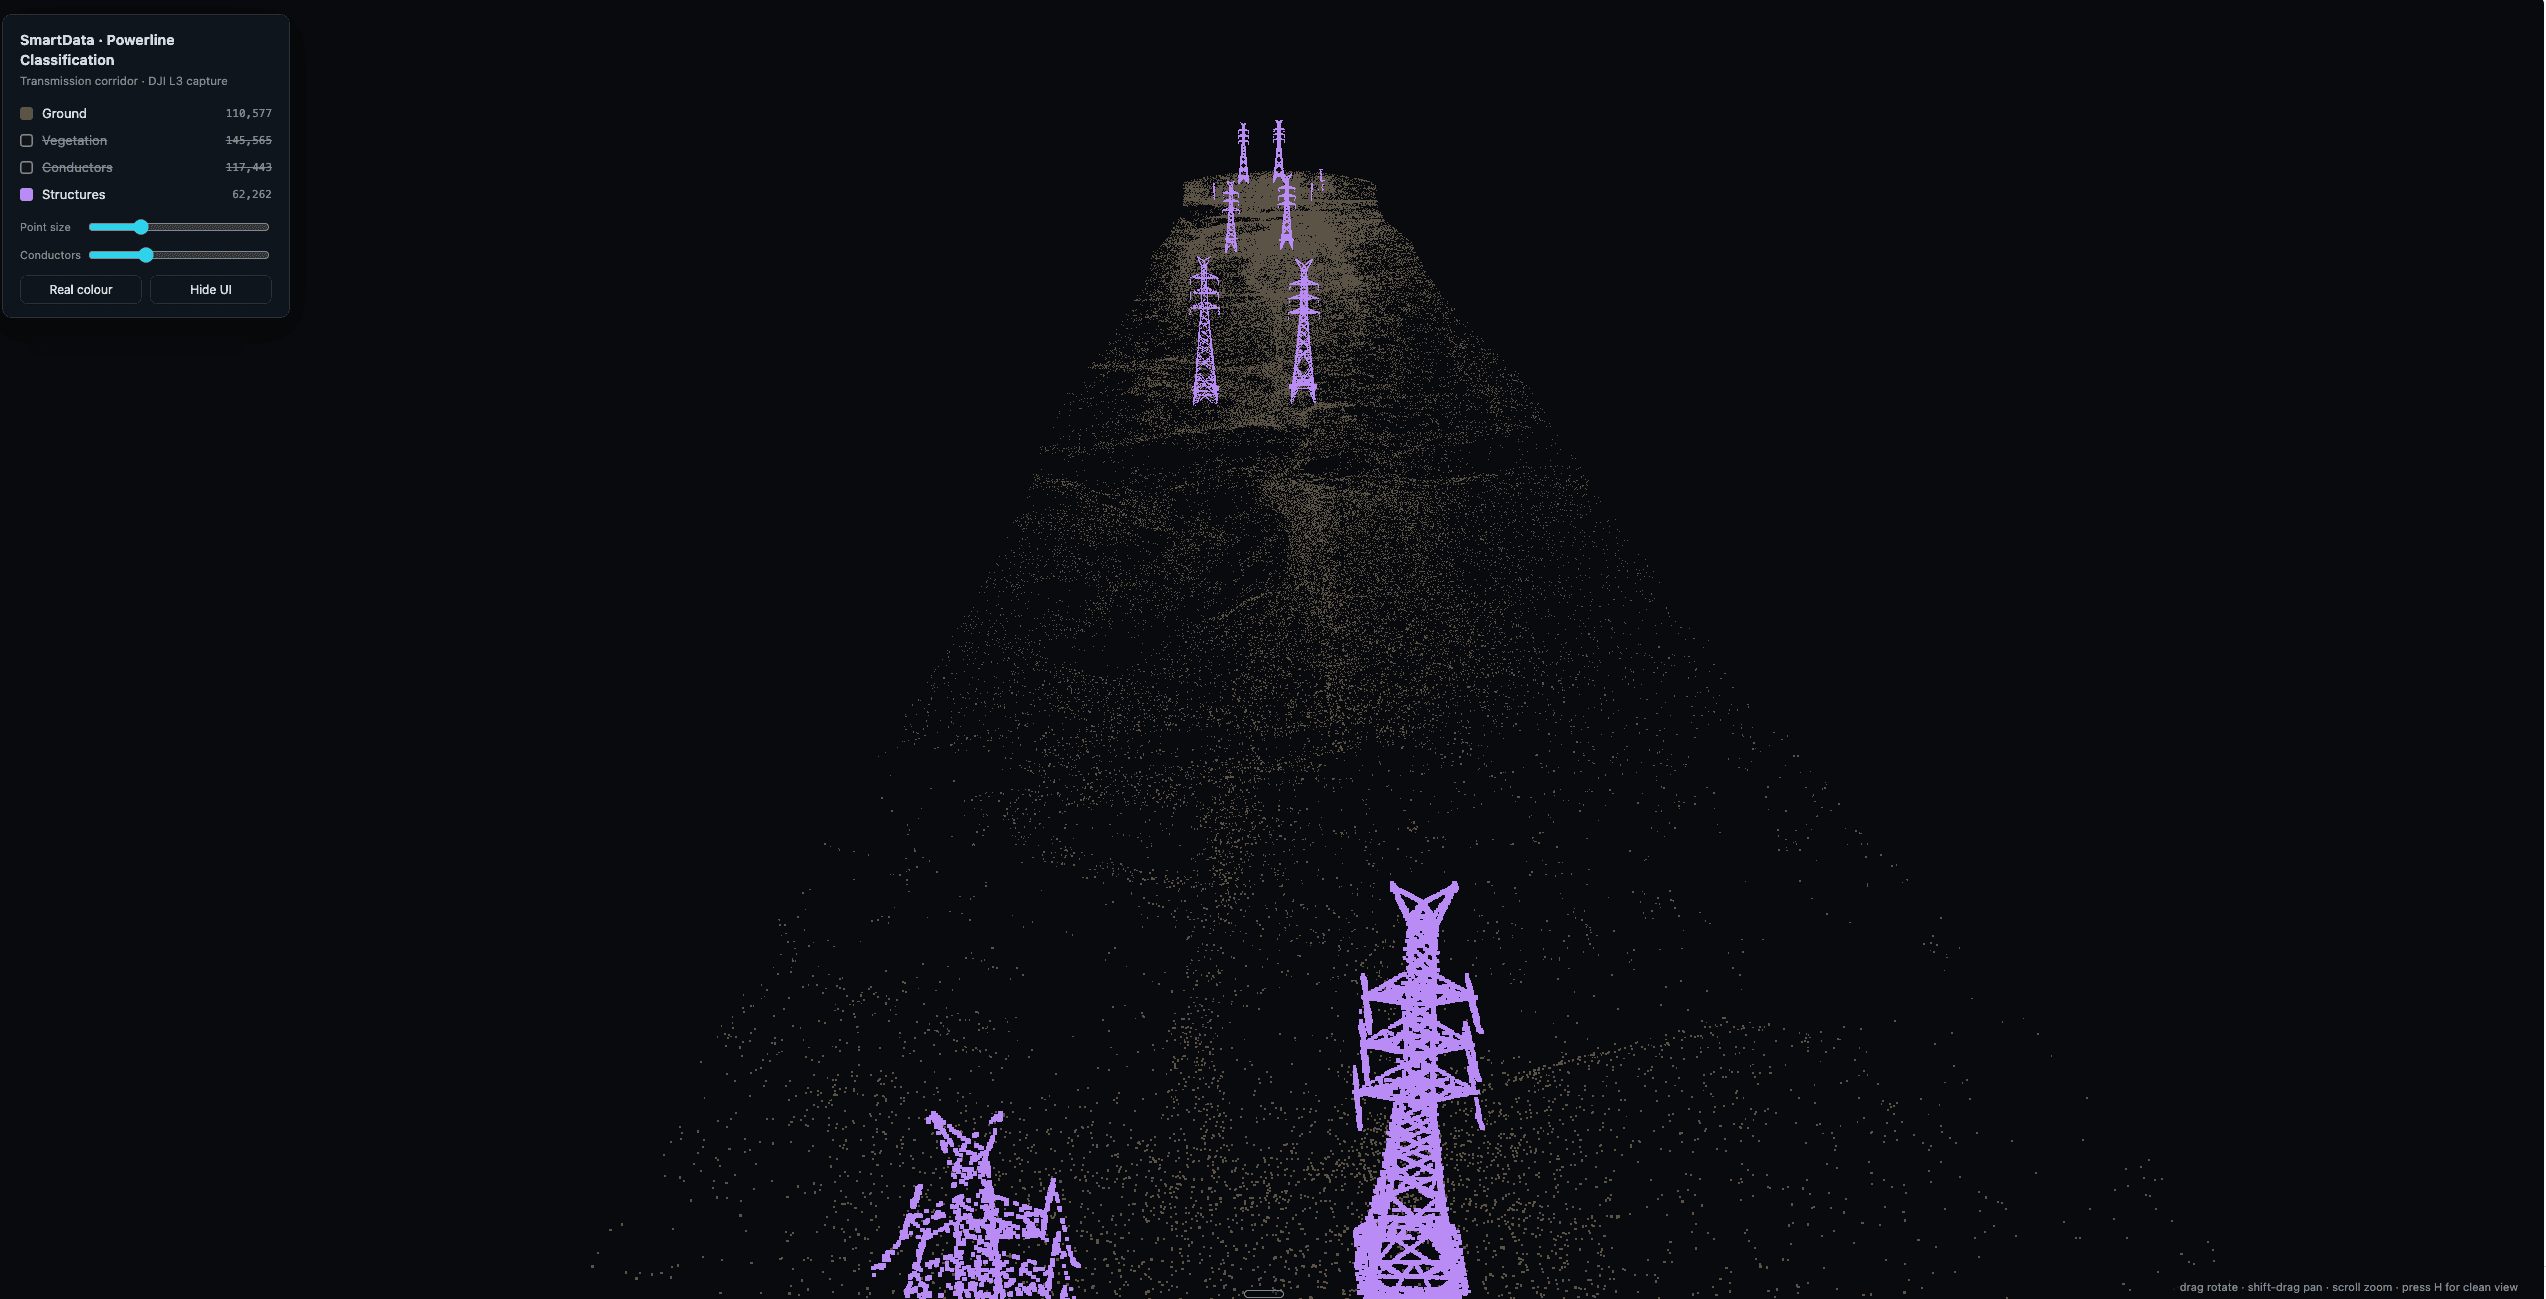
Move from an individual structure to the wider corridor without breaking the relationship between assets and terrain.
Start with a cold evaluation, then use one expert-reviewed section of your own corridor to tune the classifier. We have demonstrated the full loop from review to retrained model in under a day.
Operational outcomes
Classification is the foundation. The same network can then support conductor geometry, span analysis, vegetation screening, contours, clearance envelopes, and evidence reporting for asset and vegetation teams.
Classified conductors, poles, towers, vegetation, and ground
Conductor geometry, pole clustering, and ordered spans
Catenary fitting and survey-day clearance context
Vegetation-encroachment and fuel screening
Worst-case thermal sag and wind blowout envelopes
Contours, QA notes, evidence reports, and review-ready hosted views
Worst-case clearance envelopes
The worst-case clearance workflow reconstructs the observed conductor state, then screens how thermal sag and design wind assumptions can change the available margin. Results carry P50 and conservative P05 bands, uncertainty drivers, assumptions, and excluded spans.
1.6 km
demonstration corridor
14
measured spans from 391-557 m
0
screened clearance breaches in the demonstration
7.9 m
maximum hidden margin quantified
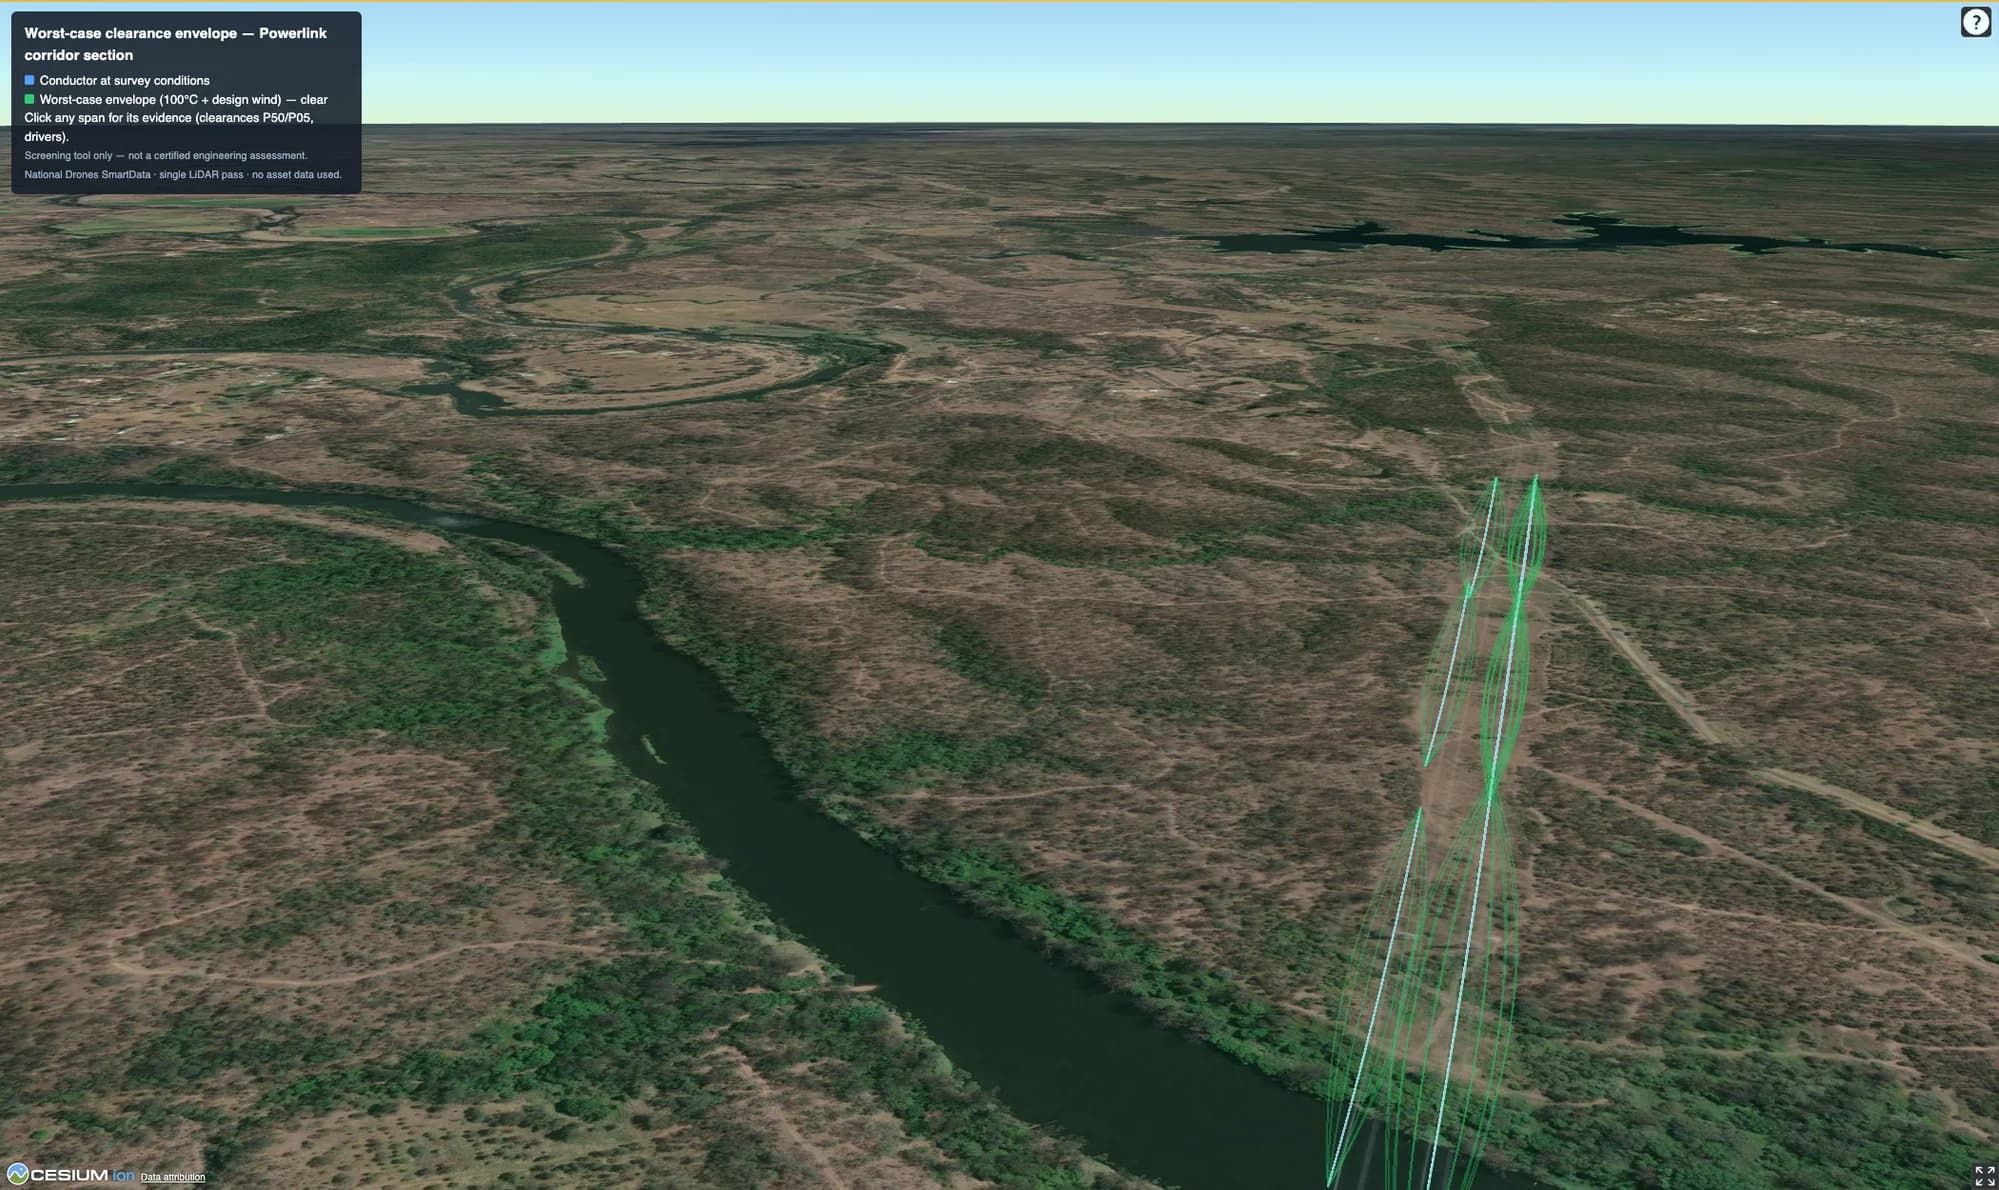
Survey-day position versus worst case
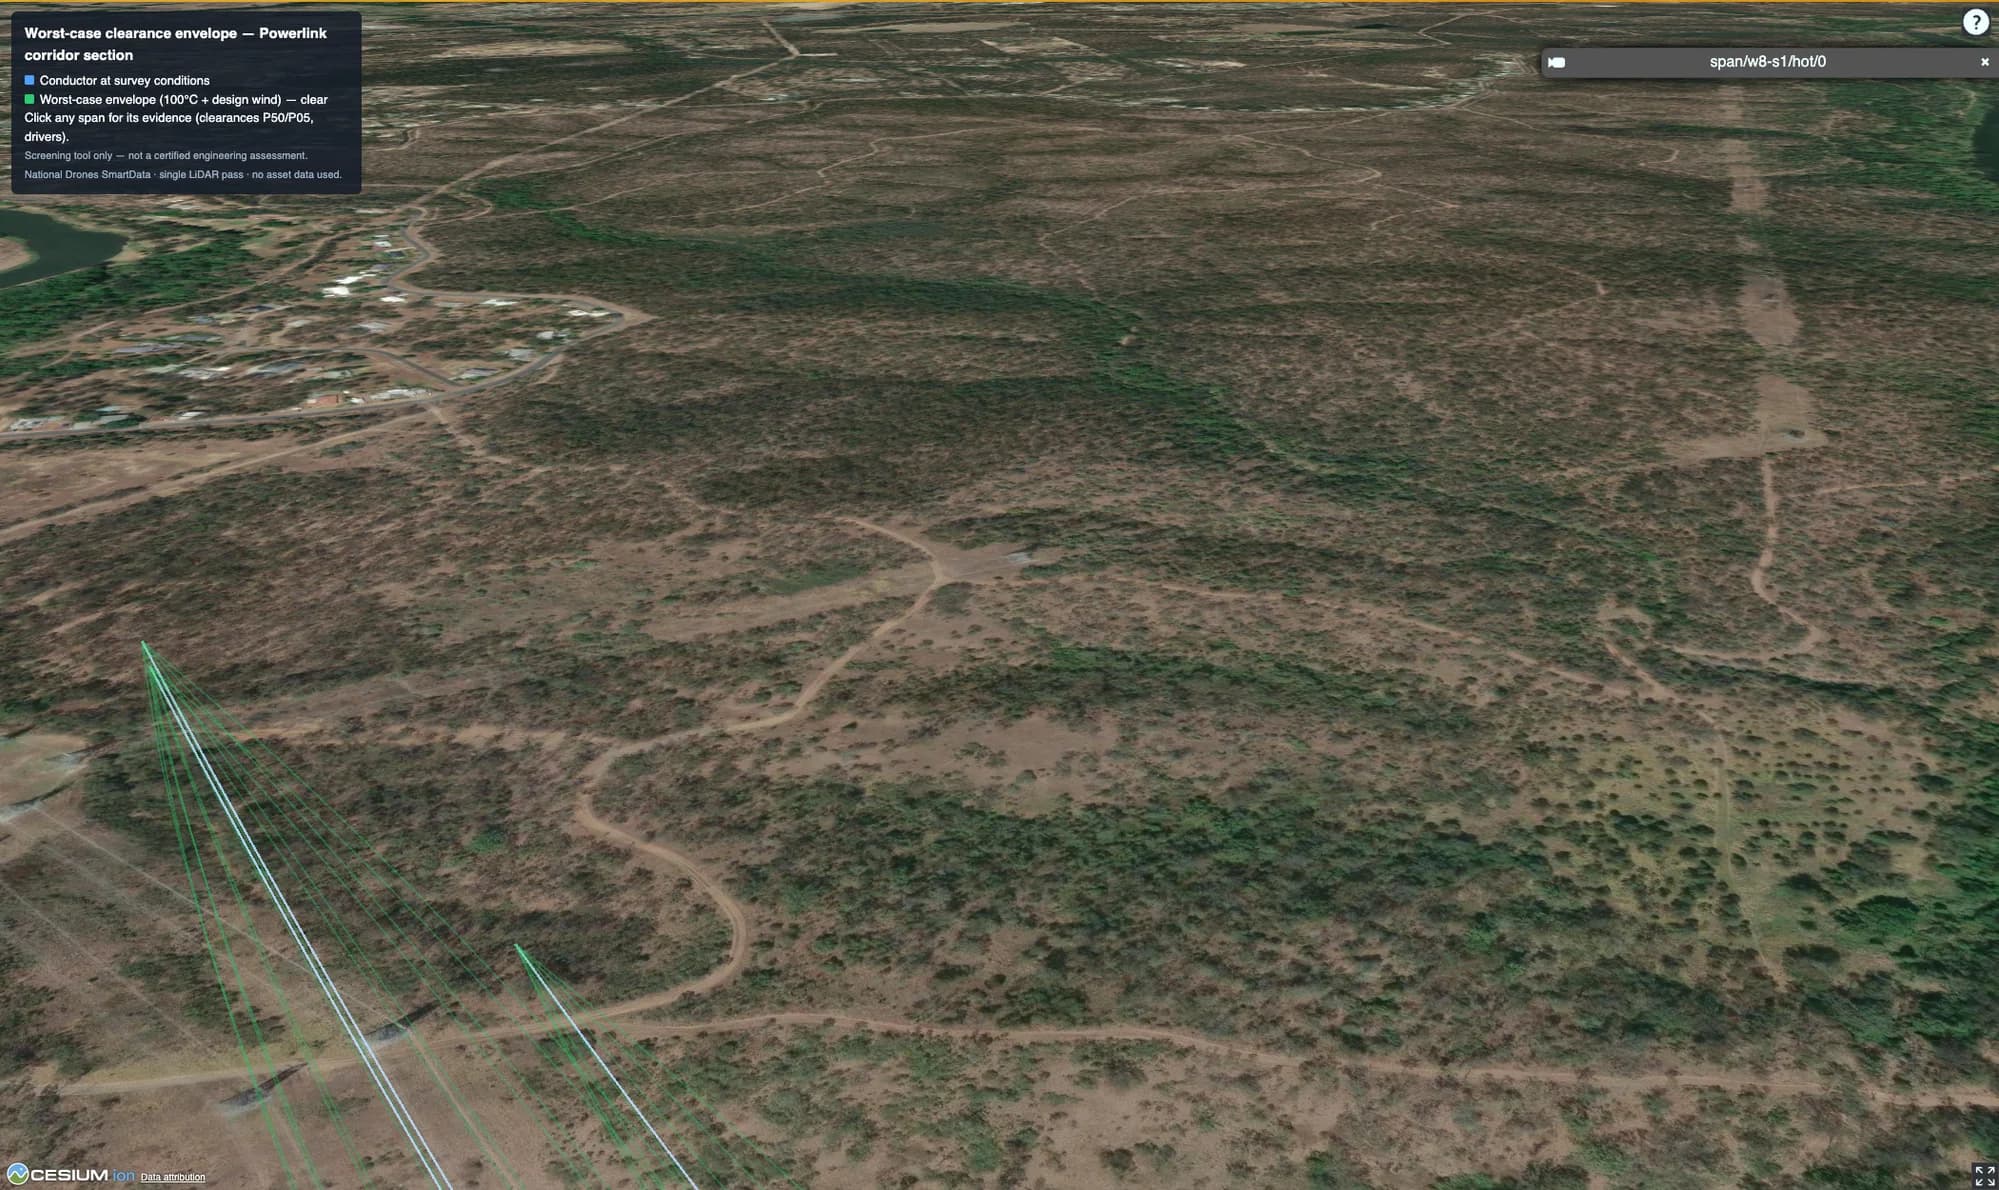
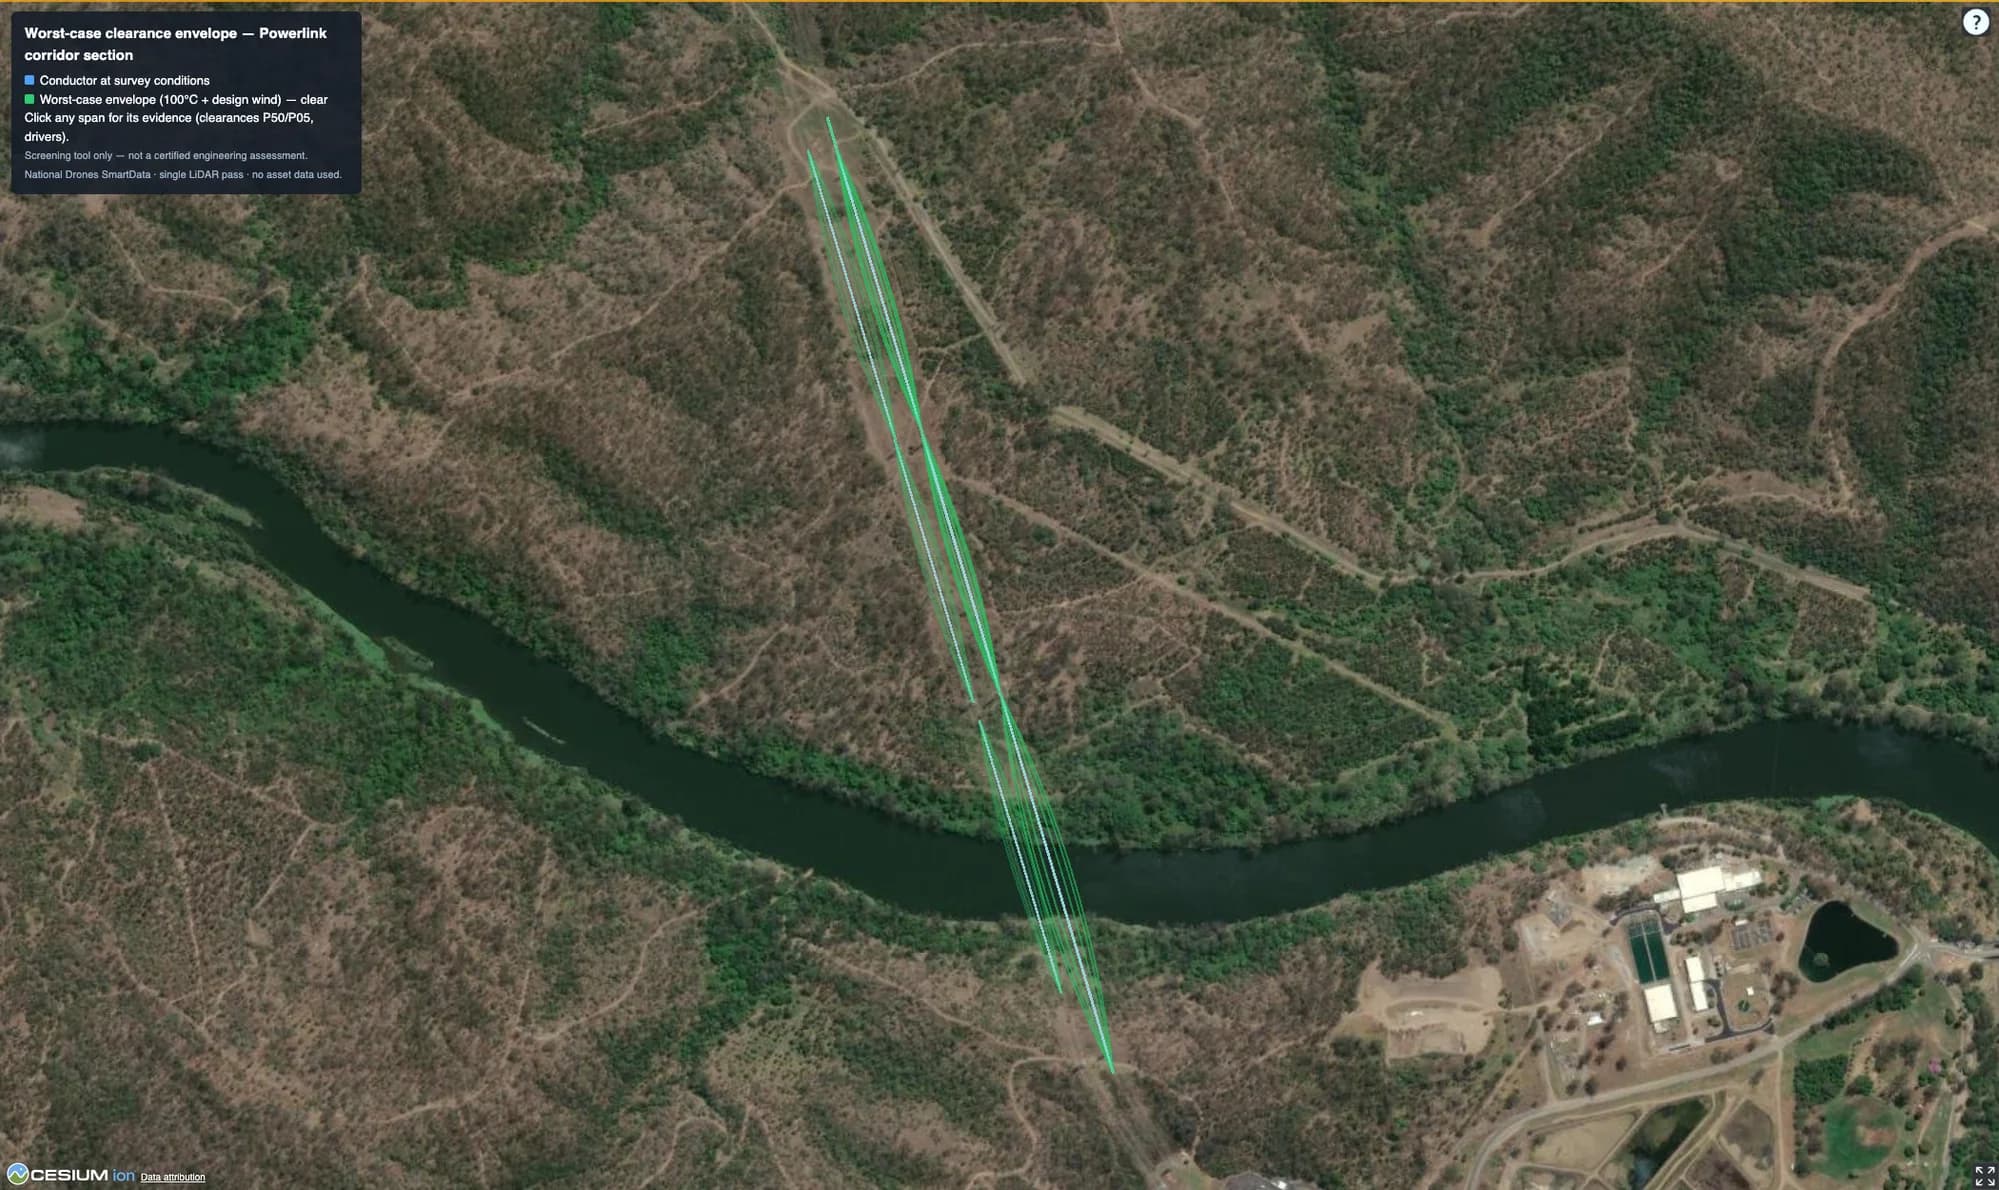
Corridor review
Compare survey-day conductors with modelled hot-and-wind envelopes, then select individual spans to review the clearance evidence and assumptions behind each screening result.
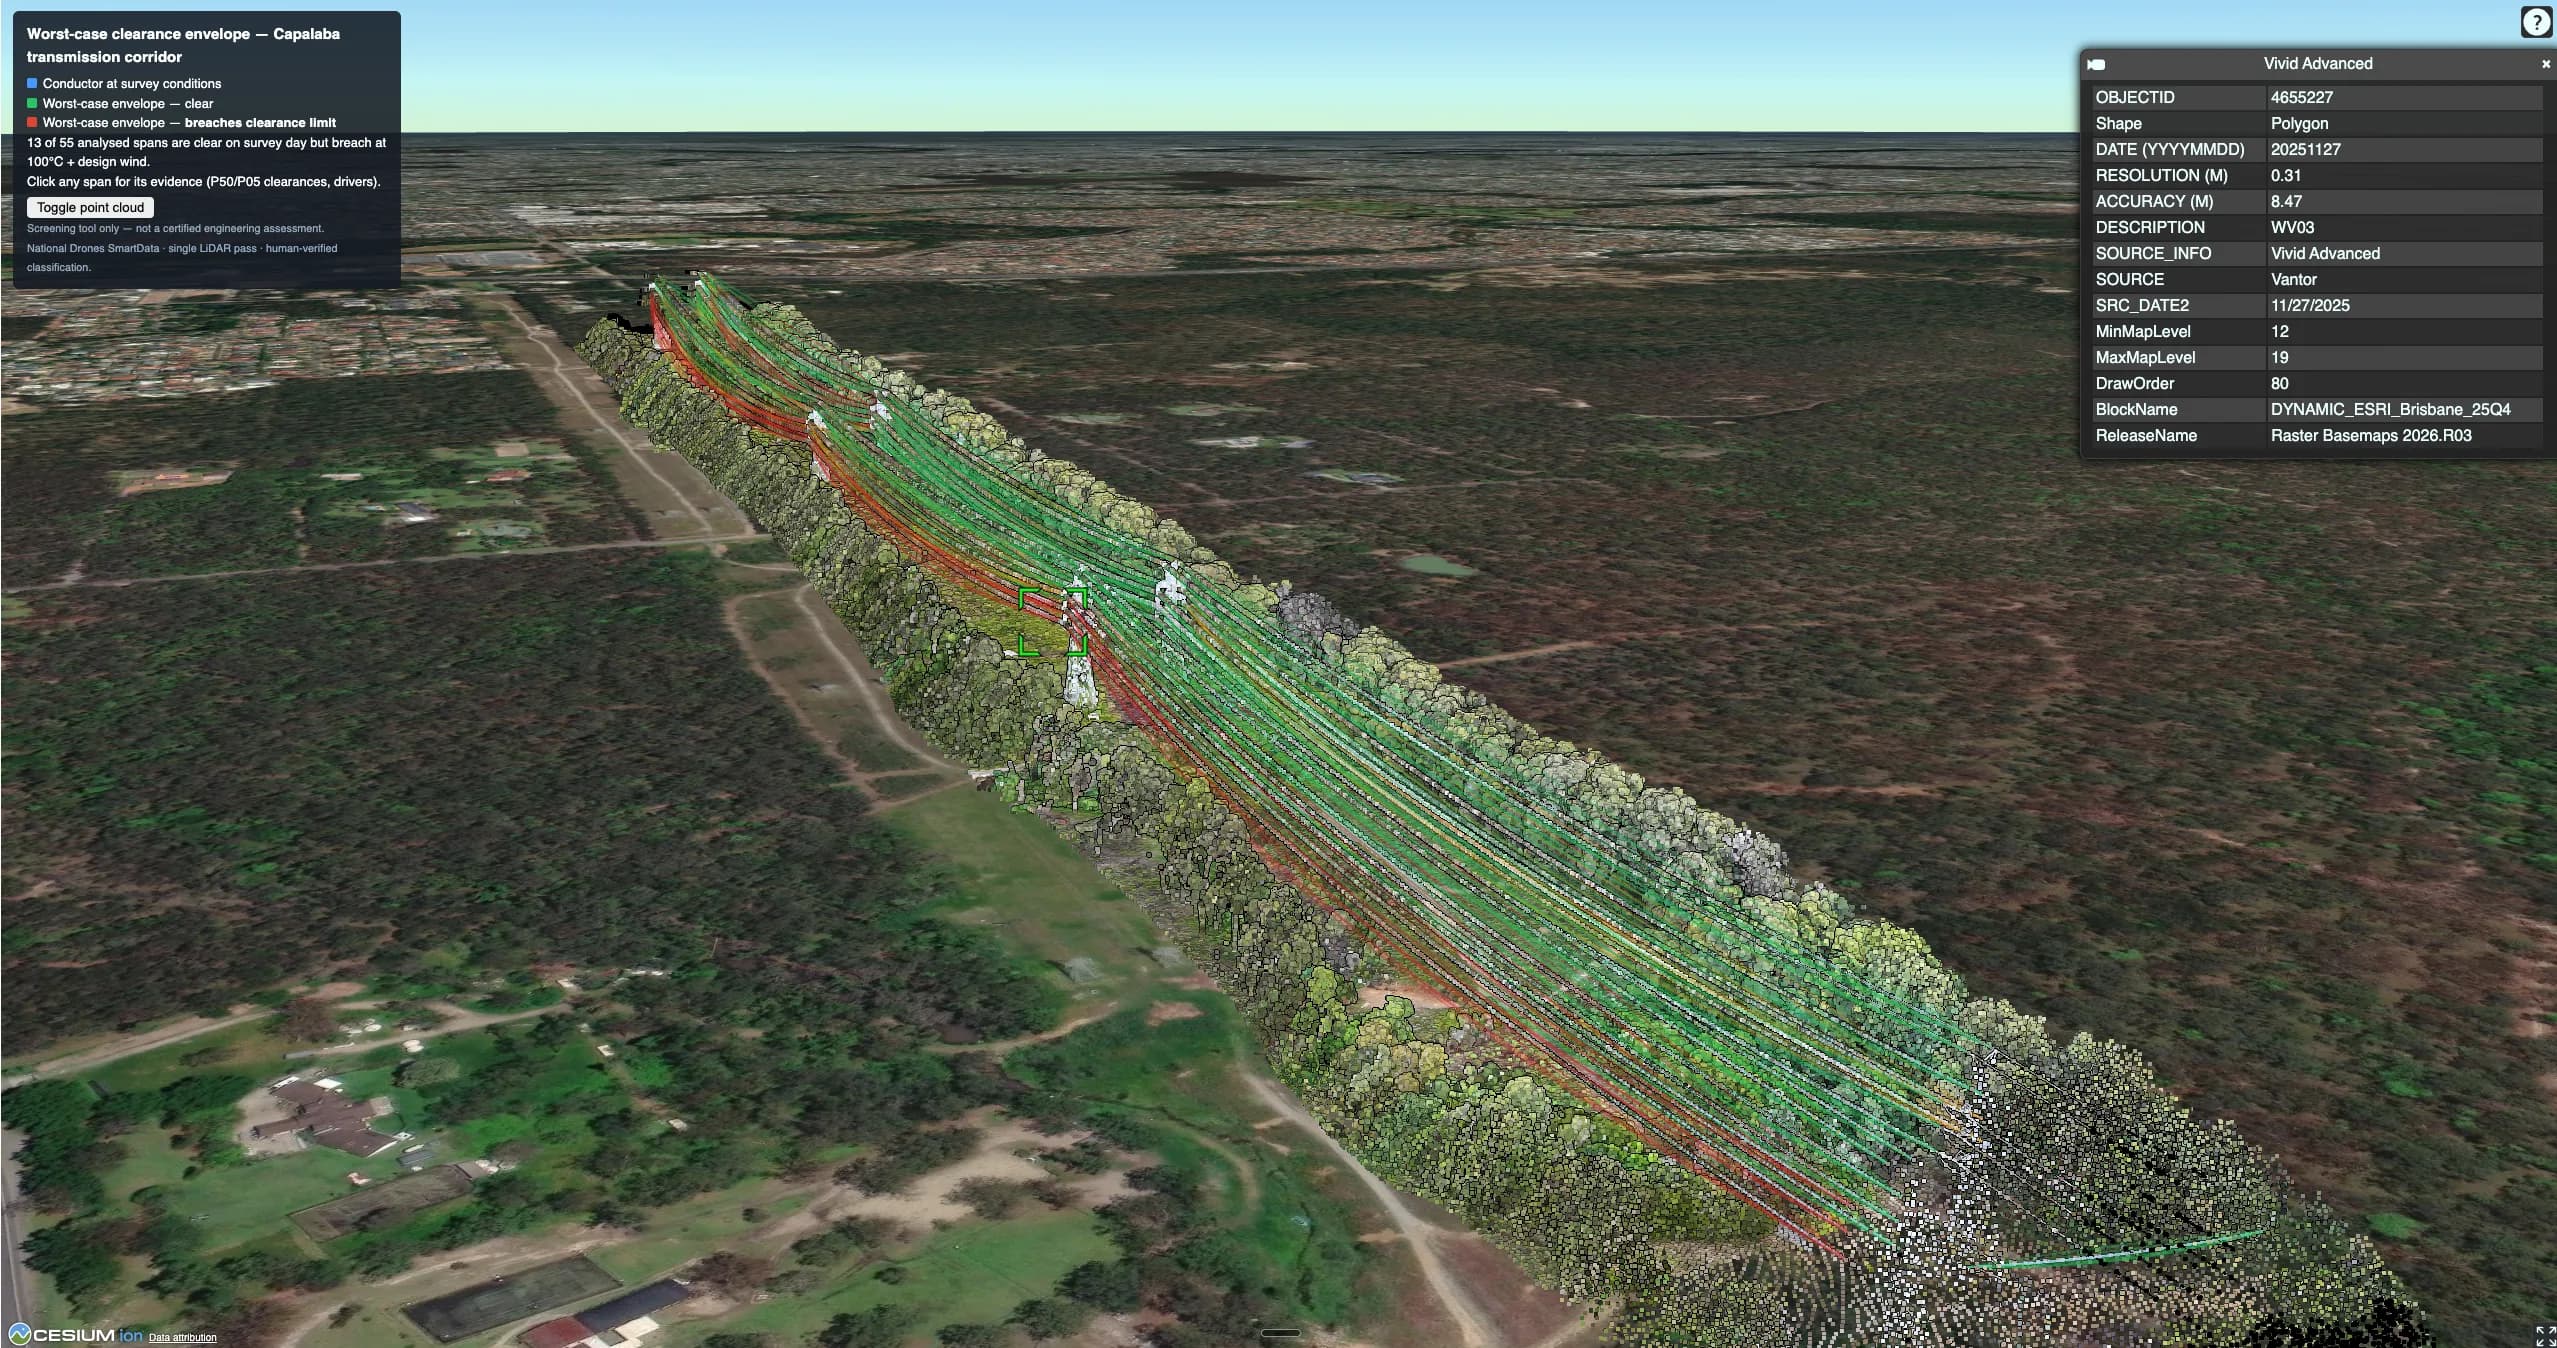
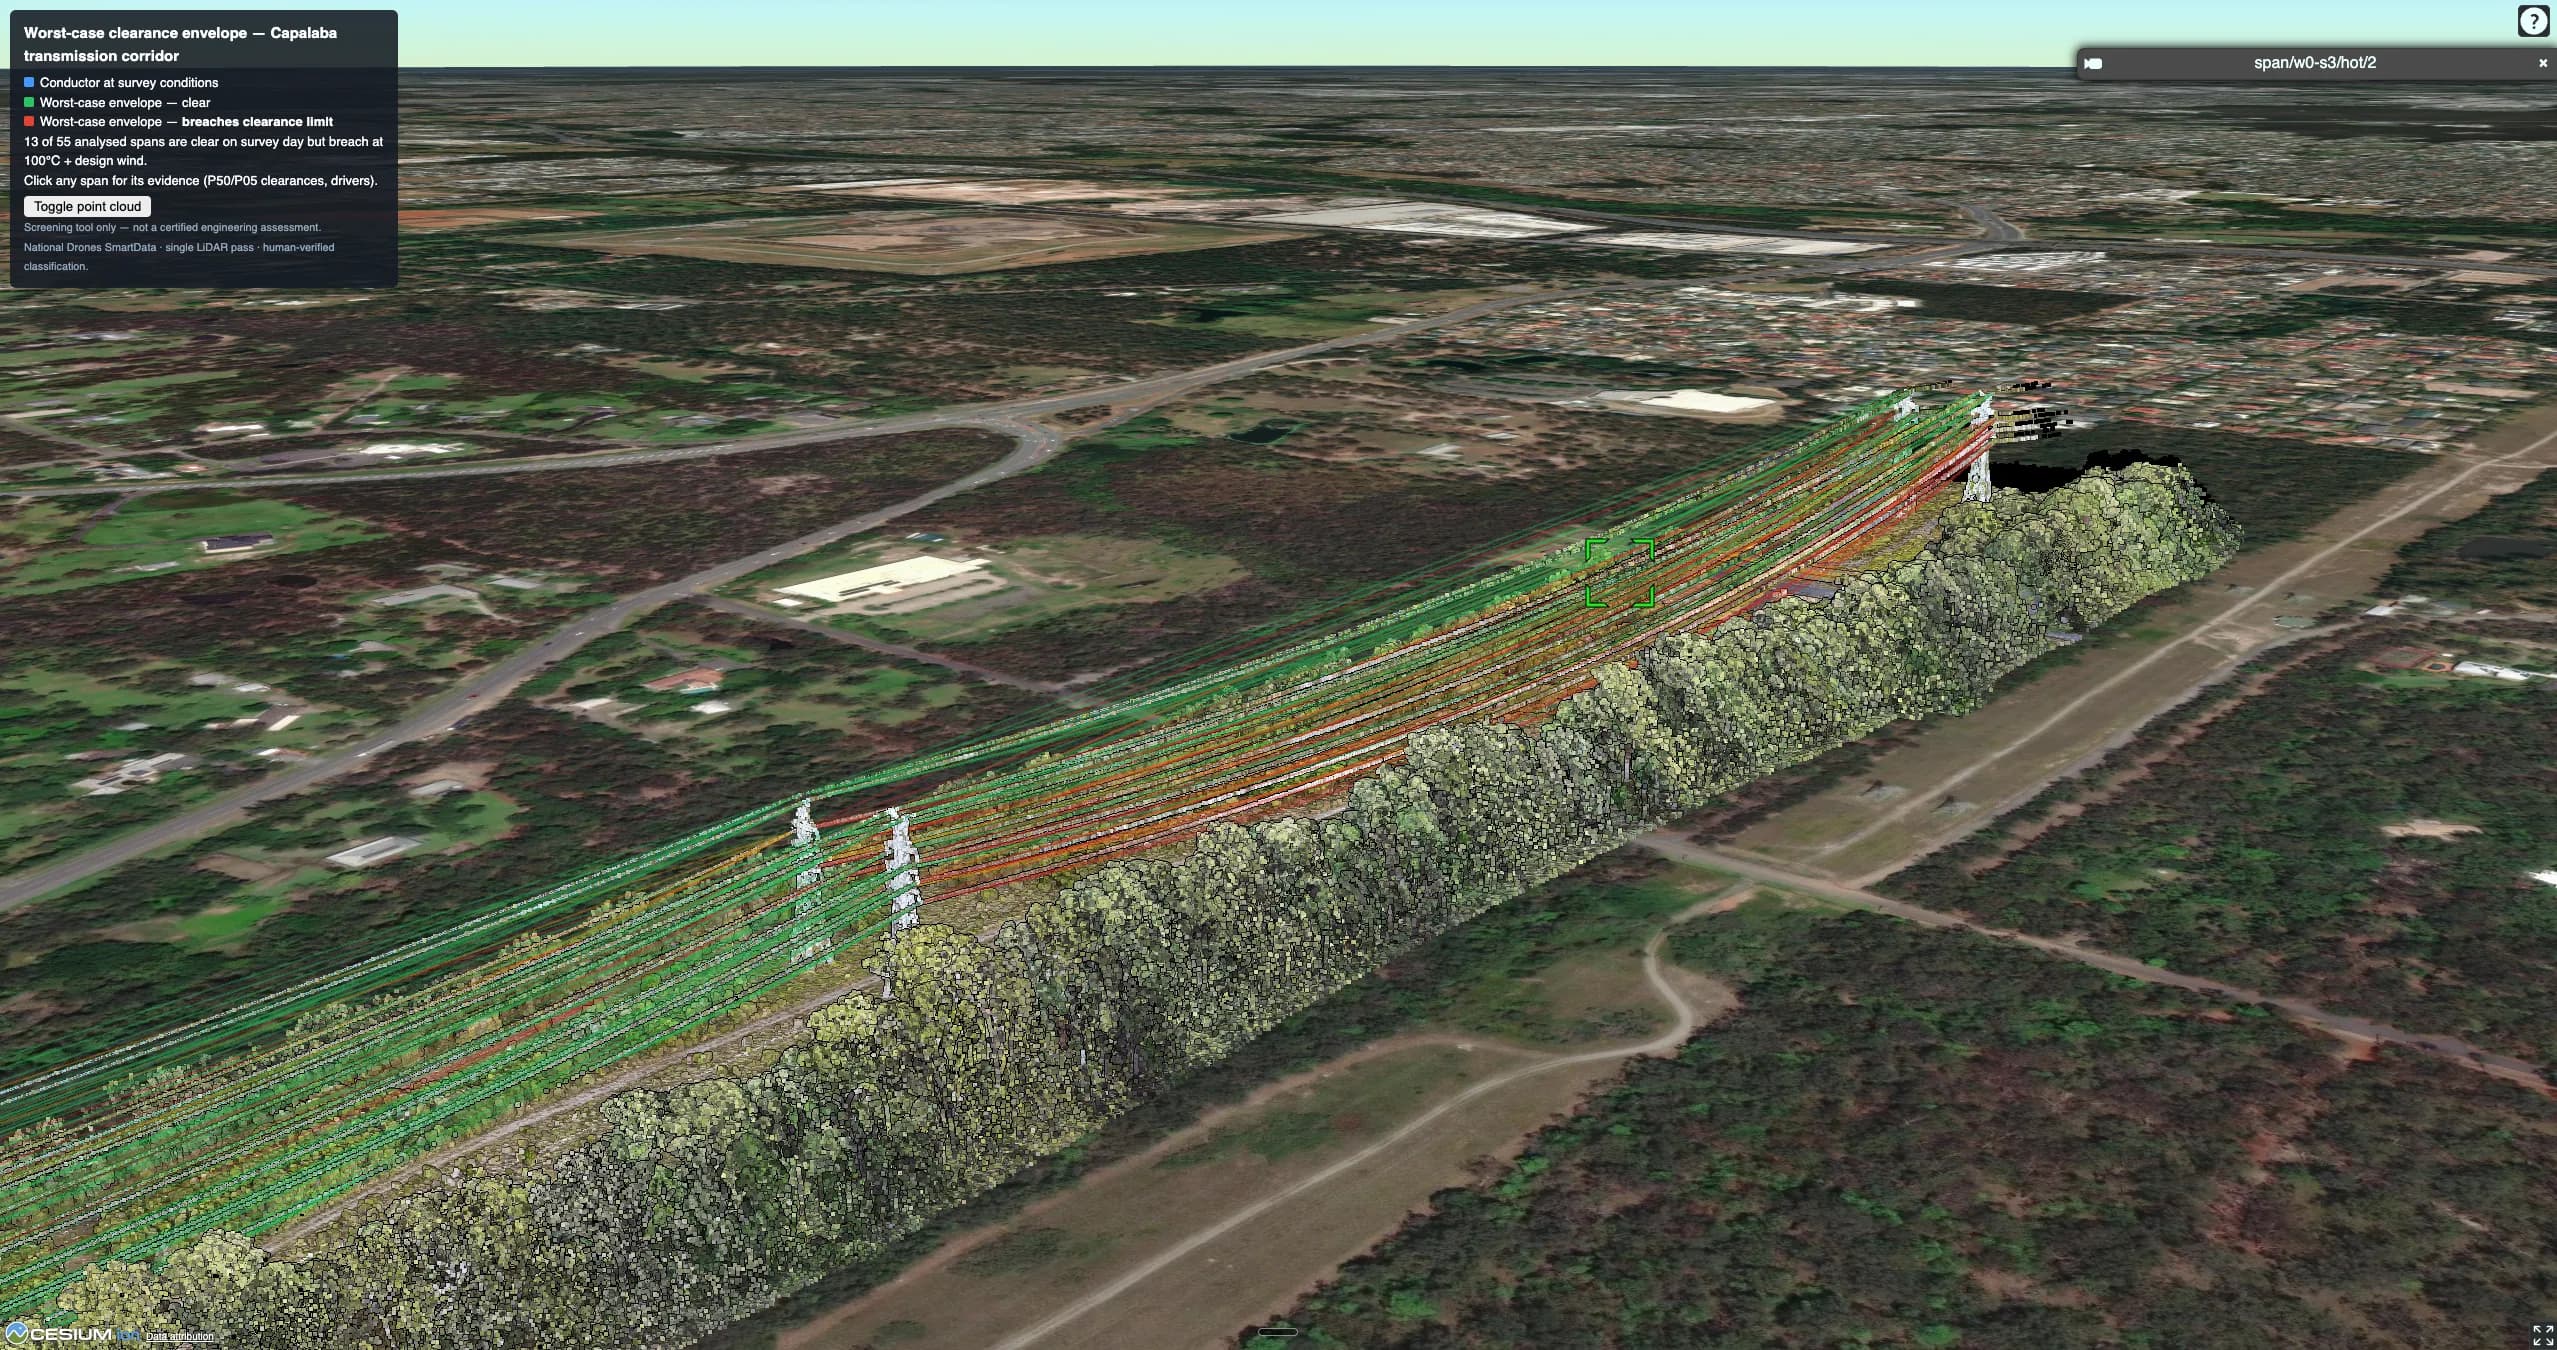
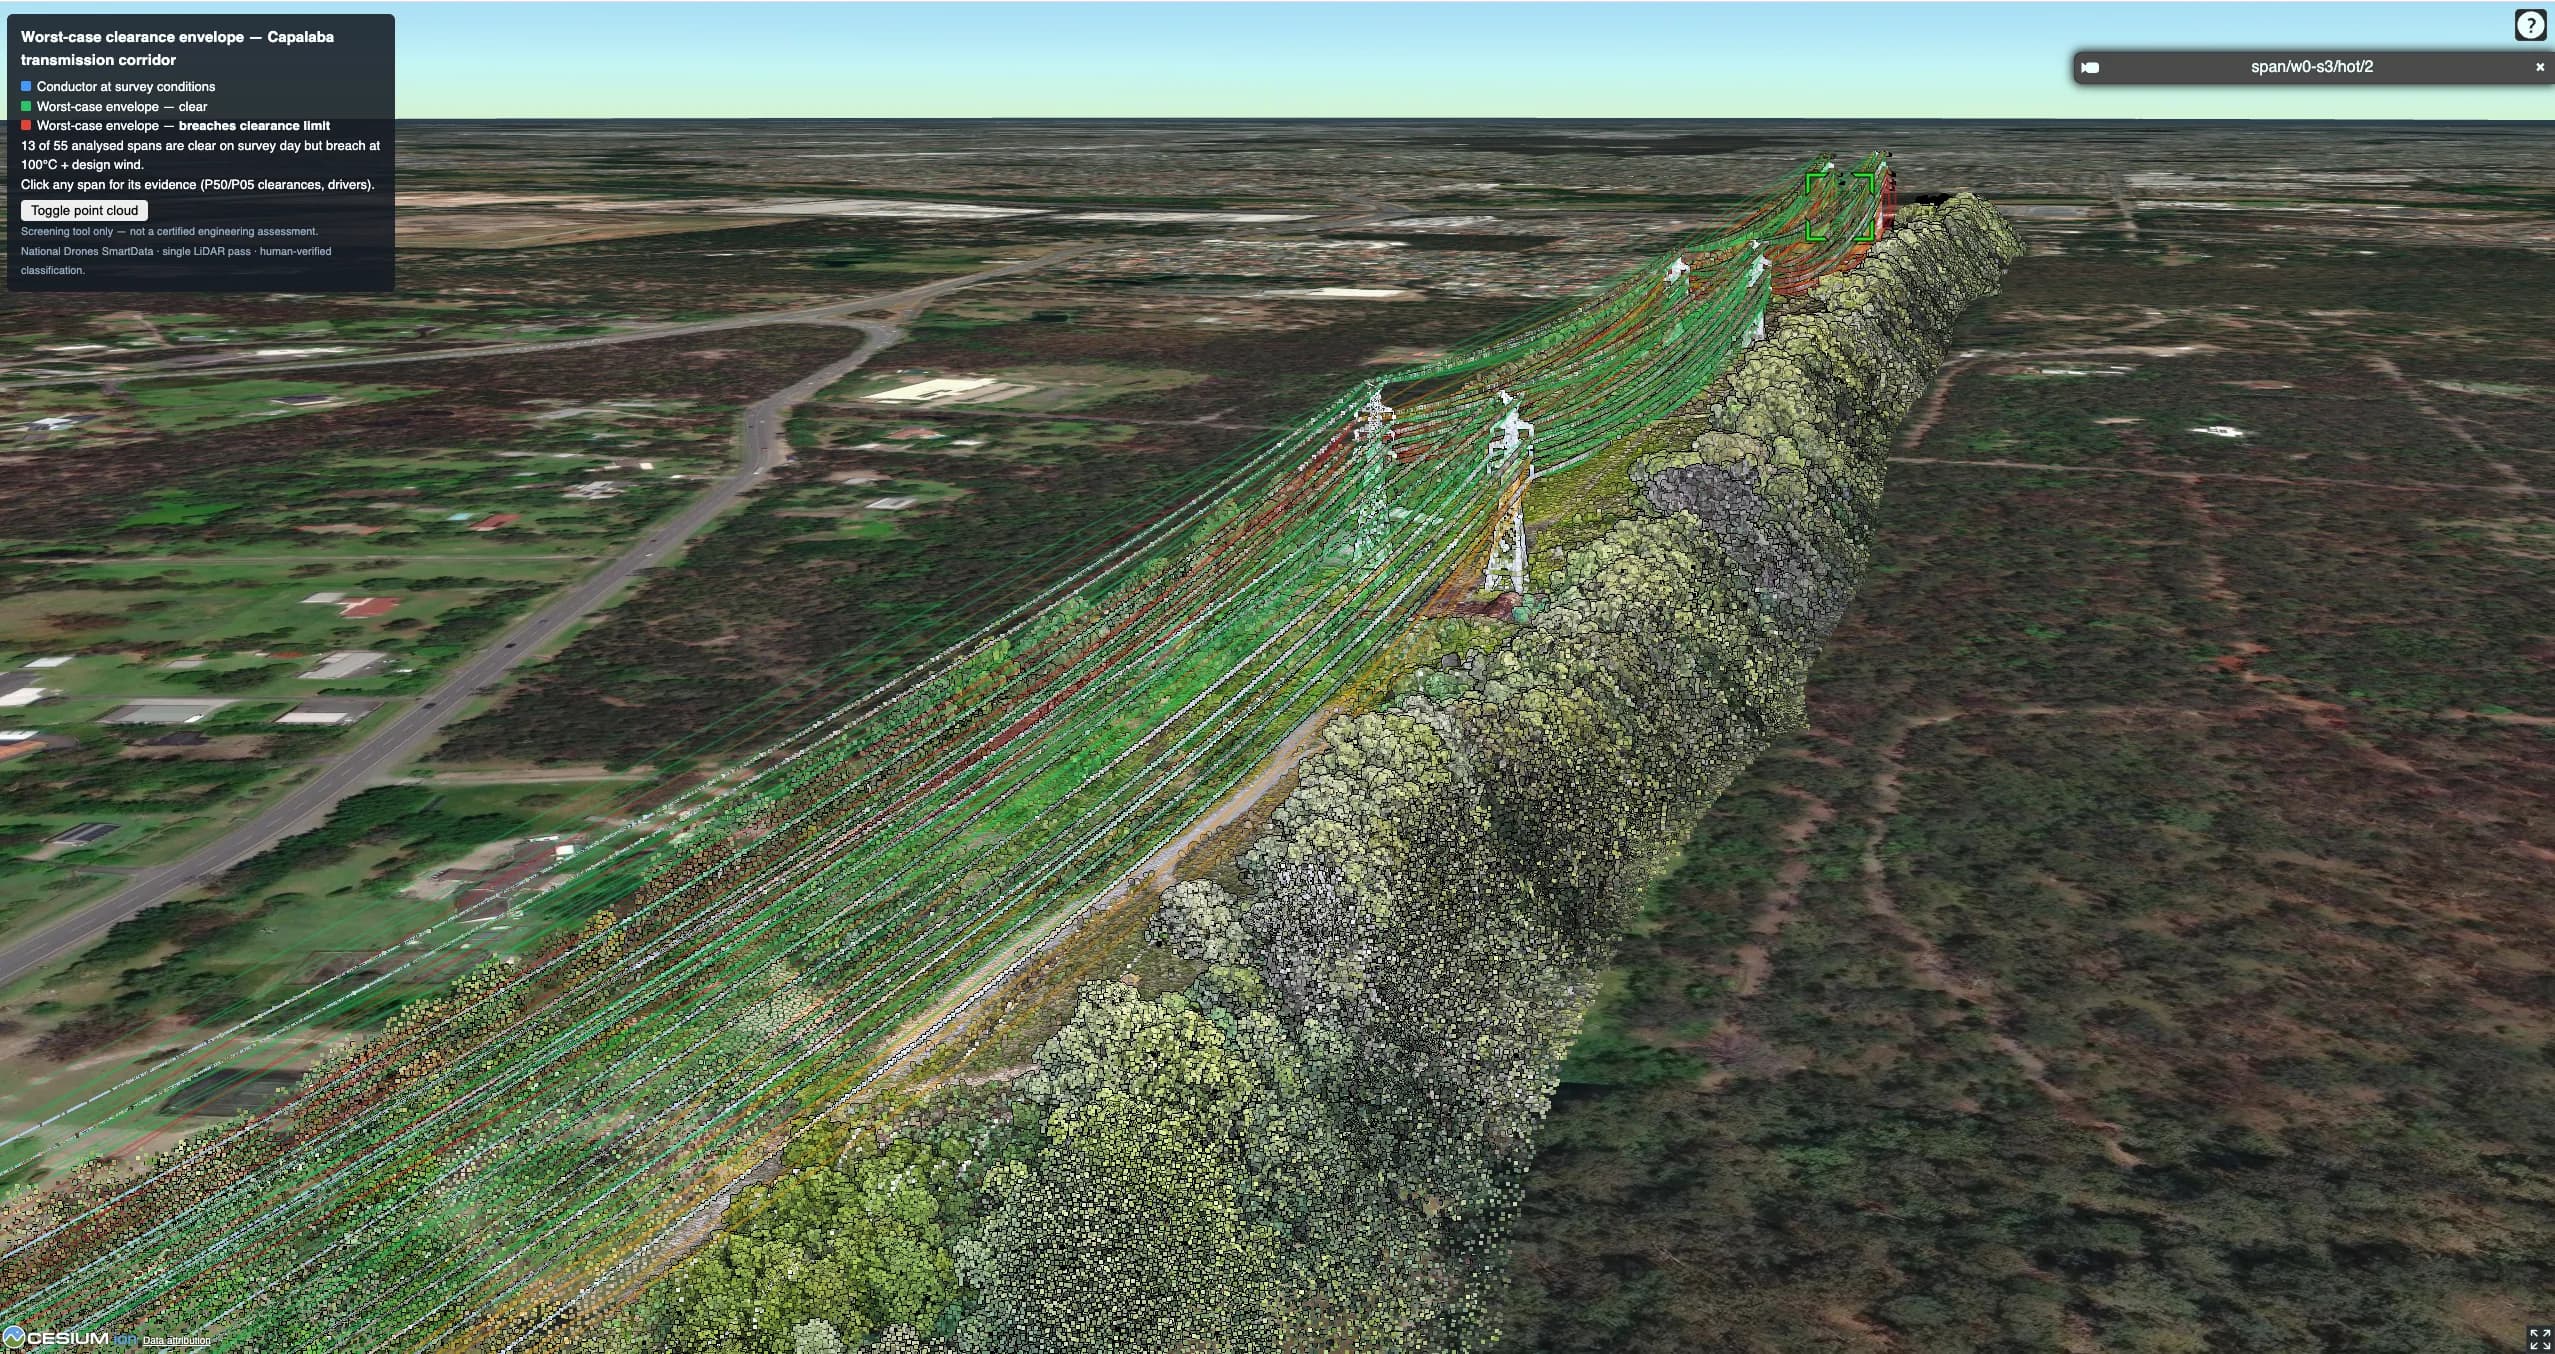
A single LiDAR pass was used to separate phases, reconstruct observed conductor state, and screen 14 spans under a 100 C conductor-temperature scenario plus design wind assumptions. The demonstration reported no screened breaches and quantified up to 7.9 m of margin that was not visible from the survey-day wire position alone.
View the clearance screening case study (PDF)2-page PDF with assumptions, methodology, and span-level results.
Have a corridor to evaluate?
See the baseline on your own data before deciding how to proceed.
Run a cold evaluationScreening and prioritisation only
Clearance-envelope outputs are produced under stated assumptions. They are not a certified engineering assessment and do not replace detailed design tools or engineering sign-off.
Delivery workflow
SmartData keeps classification, QA, hosted review, network analytics, and evidence outputs connected instead of handing teams another disconnected point-cloud file.
Upload or hand off a supported corridor LiDAR capture for a cold baseline evaluation.
Classify conductors, poles and towers, vegetation, and ground, with confidence and QA context.
Review classes in the hosted point cloud and submit an expert-reviewed section for optional tuning.
Build conductor geometry, ordered spans, contours, encroachment screening, and clearance envelopes where scoped.
Share browser-based results, evidence exports, assumptions, exclusions, and recommended follow-up.
Clear boundaries around data inputs, model tuning, evaluation, and engineering follow-up.
No. A cold evaluation can start from a suitable corridor LiDAR capture so the baseline classifier can be assessed before any network-specific tuning. Existing usable classes can also be retained where appropriate.
It runs representative data through the baseline workflow with no network-specific tuning. You can review conductor and structure extraction, exclusions, QA notes, and downstream analytics before deciding whether to tune the model or expand the corridor.
Yes. A small expert-reviewed section can be used to tune the classifier for local structure types, vegetation, and capture characteristics. SmartData has demonstrated the review-to-retrained-model loop in under a day.
No. It is a screening and prioritisation layer under stated assumptions. It identifies spans that deserve vegetation work, field review, or certified engineering follow-up; it does not replace detailed design tools or engineering sign-off.
Start with a cold evaluation and no network-specific tuning. You will see how the classifier performs on your data before deciding whether to tune it or expand the deployment.